Who Takes Care of the Kids, By Household Income
Posted by Armando Brito Mendes | Filed under estatística, visualização
Um exemplo de gráfico de barras com sub-barras
By Nathan Yau
Childcare is expensive in the United States. So as you would expect, higher-income households tend to use non-parental childcare more, whereas lower-income households tend more towards only parental care. Here are the percentages, based on 2019 estimates from the National Center for Education Statistics.
Tags: Estat Descritiva, gráfico de barras
The World Chess Championship In 5 Charts
Posted by Armando Brito Mendes | Filed under Data Science, estatística, relatórios, visualização
Uma descrição de um campeonato de xadrez com gráficos de diferença, histogramas, mapas de calor e gráficos de radar.
How Magnus Carlsen cemented his GOAT status over 11 games.
By Simran Parwani and Oliver Roeder
Published Dec. 14, 2021
This article is part of our 2021 World Chess Championship series.
The 2021 World Chess Championship ended last week with Magnus Carlen of Norway, the world No. 1, defending his title against challenger Ian Nepomniachtchi of Russia. It was Carlsen’s fifth victory in the world championship, a title he has held since 2013, and the match went a long way toward cementing his status as the greatest chess player of all time.
The contest featured some of the best chess ever played by humans, nearly flawless even when examined by modern, superhuman machines. It also featured a few inexplicable blunders, and just three bad moves saw Nepomniachtchi’s chances slip quickly and irretrievably away. The match also generated a lot of data! We’ve charted some of it below.
Tags: análise de dados, gráico de diferenças, histogramas
The Most Frequently Used Emoji of 2021
Posted by Armando Brito Mendes | Filed under estatística, relatórios, visualização
Um relatório sobre a utilização de emojis com gráficos de pontos e high-low.
By Jennifer Daniel, Unicode Emoji Subcommittee Chair
The size of each emoji illustrates its relative popularity. Can you guess this year’s number one ranked emoji? 😉
92% of the world’s online population use emoji — but which emoji are we using? Well, it appears that reports of Tears of Joy’s death are greatly exaggerated 😂. According to data collected by the Unicode Consortium, the not-for-profit organization responsible for digitizing the world’s languages, Tears of Joy accounts for over 5% of all emoji use (the only other character that comes close is ❤️ and there is a steeeeeep cliff after that). The top ten emoji used worldwide are 😂 ❤️ 🤣 👍 😭 🙏 😘 🥰 😍 😊.
This collection of mostly positive vibes may seem familiar — it is not terribly different from the last time this data was published in 2019. As infinitely creative and diverse as the world is, the top 100 emoji comprise ~82% of total emoji shares. And yet …. There are 3,663 emoji. So, why does the Unicode Emoji Subcommittee keep reviewing proposals and adding new ones? 😵💫
This existential question haunts the subcommittee 👻. So, they set out to understand popularity on a more granular level: What are the most frequently used emoji? What do they have in common? Do we have too much of one type but not enough of another? How do we interpret the 83-spot leap (from 97 to 14!) in the use of Pleading Face 🥺? Check out the changes using the interactive tools of the #UnicodeEmojiMirror Project and share your observations!
Tags: análise de dados, emojis, Estat Descritiva
Explained Visually
Posted by Armando Brito Mendes | Filed under Data Science, estatística, matemática, materiais ensino, visualização

Boas explicações visuais iterativas de conceitos de ML e matemática
Ordinary Least Squares Regression
EV 9 – 2015/02/12
Principal Component Analysis
Axis of easy.
EV 8 – 2015/01/29
Image Kernels
EV 6 – 2015/01/20
Eigenvectors and Eigenvalues
EV 5 – 2014/11/28
Pi (π)
EV 4 – 2014/11/21
Sine and Cosine
EV 3 – 2014/11/14
Exponentiation
EV 2 – 2014/11/07
Markov Chains
Mark on, Markov EV 1 – 2014/10/30 Conditional probability You probably wouldn’t understand.
Tags: análise de dados, ensino
U.S. CENSUS DATA FOR SOCIAL, ECONOMIC, AND HEALTH RESEARCH
Posted by Armando Brito Mendes | Filed under Data Science, data sets, estatística
Uma boa fonte de dados norte-americanos sobre census e saúde
IPUMS USA collects, preserves and harmonizes U.S. census microdata and provides easy access to this data with enhanced documentation. Data includes decennial censuses from 1790 to 2010 and American Community Surveys (ACS) from 2000 to the present.
Use it for GOOD — never for EVIL
Tags: census data, dados, saúde
Age and Occupation
Posted by Armando Brito Mendes | Filed under Data Science, estatística, visualização

Um bom gráfico interativo de intervalos de confiança de idades, um para cada emprego
By Nathan Yau
Whether it’s because of experience, physical ability, or education level, some jobs tend towards a certain age of worker more than others. For example, fast food counter workers tend to be younger, whereas school bus drivers tend to be older.
These are the age ranges for 529 jobs. Search for your job or look at others.
Tags: análise de dados, belo, empregos, Estat Descritiva, idades
How Men and Women Spend Their Days
Posted by Armando Brito Mendes | Filed under Data Science, estatística, relatórios, visualização

Um bom exemplo de gráficos de linhas acumuladas ou gráfico de diferenças
By Nathan Yau
For the employed, unemployed, and those not in the labor force, the charts below show the percentage of people doing an activity over a day in 2020. Switch between a weekday or a weekend day. Select activities to see individually.
Tags: análise de dados, belo, Estat Descritiva, homens e mulheres, ocupação
The pandemic marks another grim milestone: 1 in 500 Americans have died of covid-19
Posted by Armando Brito Mendes | Filed under estatística, relatórios, visualização

Um bom exemplo da utilização de valores relativos em vez de valores absolutos
By Dan Keating, Akilah Johnson and Monica Ulmanu Updated Sept. 15 at 9:00 a.m.Originally published Sept. 15, 20210
At a certain point, it was no longer a matter of if the United States would reach the gruesome milestone of 1 in 500 people dying of covid-19, but a matter of when. A year? Maybe 15 months? The answer: 19 months.
Given the mortality rate from covid and our nation’s population size, “we’re kind of where we predicted we would be with completely uncontrolled spread of infection,” said Jeffrey D. Klausner, clinical professor of medicine, population and public health sciences at the University of Southern California’s Keck School of Medicine. “Remember at the very beginning, which we don’t hear about anymore, it was all about flatten the curve.”
Tags: covid-19, Estat Descritiva, EUA
Olympians are probably older — and younger — than you think
Posted by Armando Brito Mendes | Filed under Data Science, estatística, relatórios, visualização
Um relatório com vários gráficos tipos histogramas unidimensionais (gráficos de pontos)
There were some outliers in the old days, but even in Tokyo, athletes range from boomers through Gen Z
By Bonnie Berkowitz andArtur Galocha July 31
As you would expect, two-thirds of the roughly 11,700 Olympians competing in Tokyo are in their 20s. Prime of life, blah blah blah.
But the rest of the athletes range from two preteens to four 60-somethings, and the older competitors nudged up the average age to 27 for the first time since 1948.
Since the first modern Olympics in 1896, the wide range of sports has allowed for a wide range of sportsmen — and sportswomen, beginning in 1900.
A 10-year-old boy competed in that first Games, and several septuagenarians have suited up. (A 98-year-old sort of competed in 1928, but whether he counts is debatable because he was entered in the art competition and also was dead.)
Tags: gráfico de pontos, idades, olimpiadas
Data Visualization In Excel Using Python
Posted by Armando Brito Mendes | Filed under estatística, lições, materiais ensino, materiais para profissionais, SAD - DSS, software
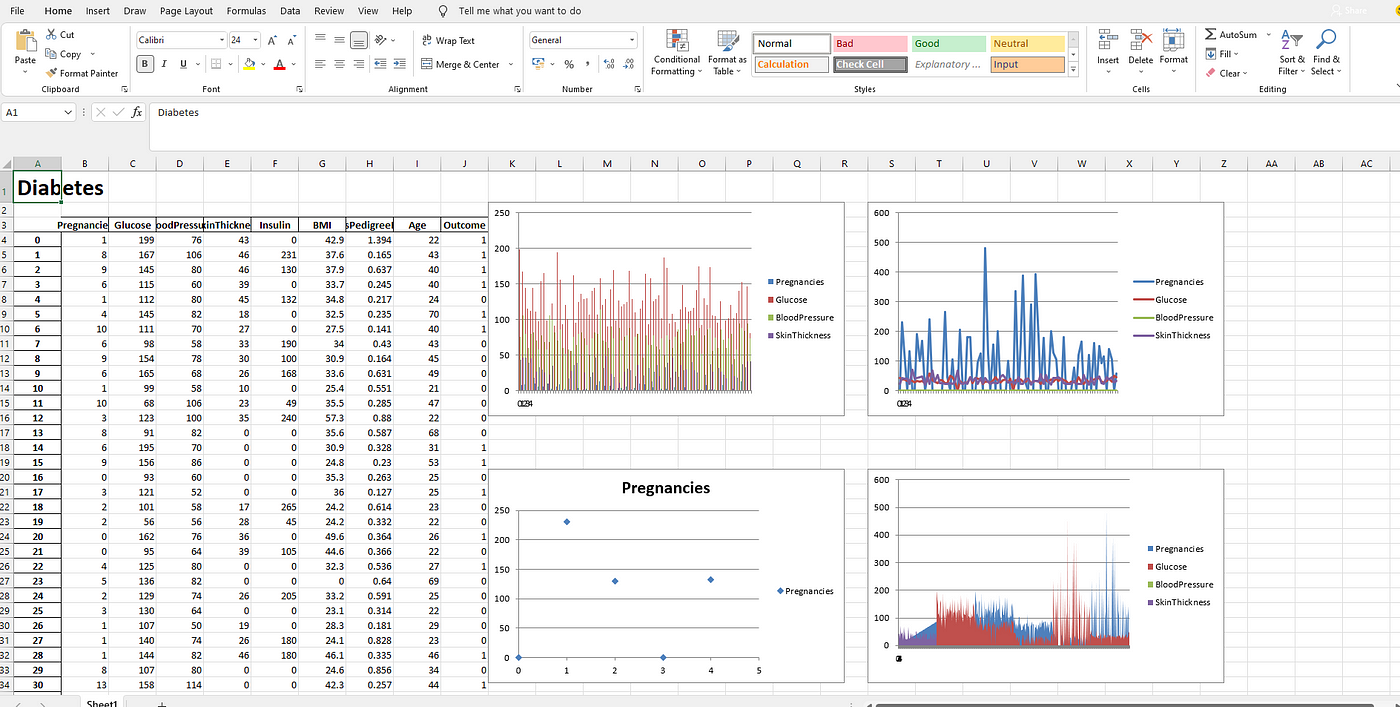
Um pequeno tutorial para utilizar ExcelWriter em Python
Using ExcelWriter for Creating Visualizations in Excel by Python Code
Himanshu Sharma4 days ago·3 min read
Excel is widely used for data analysis and has a lot of functionalities for analyzing, manipulating, visualizing, etc. Using excel should be one of the main skills required for a Data Analyst, Product Analyst, and Business Analyst. It helps in understanding the data and how we can use it for generating useful insights.
Python is also widely used for Data Analysis purposes and also overcomes the drawbacks of Excel. With a little knowledge of Python, we can enhance our Data Analysis skills and also generate more useful insights.
Combining both Excel and Python can be fruitful and makes Data Analysis more interesting. ExcelWriter is used for performing different Excel operations using Python. It provides a wide variety of functionalities like creating an Excel, writing data into an Excel sheet, creating visualizations in Excel, etc.
Tags: dataviz, Excel, Python, visualizações