Why Line Chart Baselines Can Start at Non-Zero
Posted by Armando Brito Mendes | Filed under Data Science, estatística, lições, visualização

Uma boa demonstração, com gráficos dinâmicos, de como os gráficos podem ser enganadores
By Nathan Yau
There is a recurring argument that line chart baselines must start at zero, because anything else would be misleading, dishonest, and an insult to all that is good in the world. The critique is misguided.
Tags: enganador, gáfico de linhas, gráficos, linha base
100 visualizations from one simple dataset
Posted by Armando Brito Mendes | Filed under Data Science, materiais para profissionais, visualização

Montes de visualizações para uma tabela de dados com duas linhas e 3 colunas
Can we come up with 100 visualizations from one simple dataset?
As an information design agency working with data visualization every day, we challenged ourselves to accomplish this using insightful and visually appealing visualizations.
We wanted to show the diversity and complexity of data visualization and how we can tell different stories using limited visual properties and assets.
Tags: dados simples, gráficos, visualizações
More pets than children in Taiwan
Posted by Armando Brito Mendes | Filed under infogramas \ dashboards, mapas SIG's, visualização
boa estória com gráficos e animações excelentes

In 2018, Taiwan officially became an “aged society,” a label reserved for populations where 15-20% are 65 years or older. But that’s only the beginning. Taiwan’s on track to reach “super-aged society” status around 2025—that’s when the share of folks 65 or older goes over 20%. This rapid demographic shift makes Taiwan one of the fastest aging countries in the world, the social and economic implications of which will need careful planning and strategic policy to address.
Tags: animações, gráficos, pirâmide de idades
Menstrual cycle length and variability: a visual explanation
Posted by Armando Brito Mendes | Filed under Data Science, visualização

uma boa estória, com boas ilustrações animadas e gráficas
A person’s menstrual cycle length and regularity are key indicators of their overall health. The Apple Women’s Health Study (AWHS ) is helping us characterize menstrual cycles throughout people’s lives, by enrolling study participants who provide their permission for us to collect and analyze data on a larger scale than ever before. This understanding can help people prepare for their menstrual cycles and help patients and clinicians personalize their healthcare.
In Part 1: What is a menstrual cycle?, we define and explain key characteristics of a menstrual cycle. In Part 2: How long is a typical cycle?, we explore the range of cycle lengths of people from the study. In Part 3: What is an irregular cycle?, we look at how much a person’s cycle varies from month to month. Finally, in Part 4: What determines cycle characteristics?, we discuss why we see variation in cycle characteristics through a person’s life, and why it’s important for everyone to understand these changes so that we can better prepare for them.
Tags: animação, gráficos, menstruação
What This Graph of a Dinosaur Can Teach Us about Doing Better Science
Posted by Armando Brito Mendes | Filed under Data Science, estatística, visualização

um texto muito bom sobre visualização de dados
“Anscombe’s quartet” and the “datasaurus dozen” demonstrate the importance of visualizing data
- By Jack Murtagh on September 7, 2023
Mark Twain once wrote, “There are three kinds of lies: lies, damned lies, and statistics.” (He attributed the quip to former British prime minister Benjamin Disraeli, but its true origin is unknown.) Given the foundational importance of statistics in modern science, this quote paints a bleak picture of the scientific endeavor. Thankfully, several generations of scientific progress have proved Twain’s sentiment to be an exaggeration. Still, we shouldn’t discard the wisdom in those words. While statistics is an essential tool for understanding the world, employing it responsibly and avoiding its pitfalls requires a delicate dance.
Tags: gráficos, visualização, visualizações
The other greenhouse gas
Posted by Armando Brito Mendes | Filed under infogramas \ dashboards, materiais para profissionais, visualização

Excelente infograma com pictogramas e animações muito boas
How methane from food waste contributes to global warming and why small efforts to stop it can make a big difference.
By Ally J. Levine and Daisy Chung
PUBLISHED AUG. 5, 2023
Tags: alterações climáticas, desperdício, gráficos
The housing market is cooling. What’s it like in your area?
Posted by Armando Brito Mendes | Filed under mapas SIG's, visualização
Um bom exemplo de um gráfico em espiral
By Kevin Schaul and
Sept. 20 at 11:35 a.m.
After spiraling to new heights during the pandemic, the housing market is finally starting to cool. Data on how fast homes have sold over the past decade shows how the market took off in the summer of 2020 and began to wind back down this spring.
Percent of homes that sold within two weeks, starting in Jan. 2012
Tags: gráfico de espiral, gráficos, preço de casas
Best Data Visualization Projects of 2021
Posted by Armando Brito Mendes | Filed under mapas SIG's, visualização
Uma boa coleção de visualizações pouco usuais, tb é possível consultar os escolhidos dos anos anteriores
By Nathan Yau
Phew, just made it. These are my favorite data visualization projects from 2021.
You can see picks from previous years here: 2008, 2009, 2010, 2011, 2013, 2014, 2015, 2016, 2017, 2018, 2019, 2020.
Like last year, there were many Covid-related charts on the internets this year. While they are important to gauge the state of things, I found myself veering away from them to focus on other areas. I craved distraction, practical information for the times, and anything outside the bubble.
A catalog of all the Covid visualizations
Posted by Armando Brito Mendes | Filed under Data Science, visualização

Muitas visualizações, em geral, muito boas e algumas muito originais
The COVID-19 Online Visualization Collection is a project to catalog Covid-related graphics across countries, sources, and styles. They call it COVIC for short, which seems like a stretch for an acronym and a confusing way to introduce a project to people. But, it does categorize over 10,000 figures, which could be useful as a reference and historical context.
How to Use t-SNE Effectively
Posted by Armando Brito Mendes | Filed under Data Science, visualização
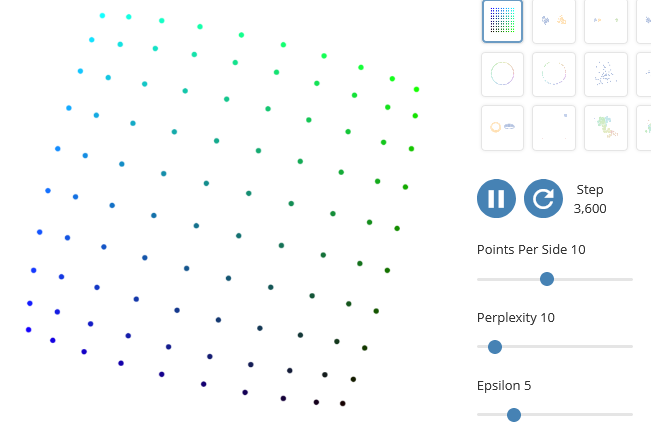
Uma explicação bastante completa sobre as dificuldades de interpretação de gráficos obtidos pelo algoritmo t-SNE
Although extremely useful for visualizing high-dimensional data, t-SNE plots can sometimes be mysterious or misleading. By exploring how it behaves in simple cases, we can learn to use it more effectively.
Tags: belo, gráficos, interpretação, t-SNE