179 Reasons You Probably Don’t Need to Panic About Inflation
Posted by Armando Brito Mendes | Filed under Data Science, estatística, relatórios, visualização

relatório dinâmico com gráficos alto \ baixo
By Josh Bivens and Stuart A. ThompsonAug. 18, 2021Gasoline (all types)March 2019March 2020March 2021Used cars and trucksMarch 2019March 2020March 2021Airline faresMarch 2019March 2020March 2021
Here’s how the price of gasoline changed each month throughout 2019, compared with the previous year. ↑ Red means the price went higher, while ↓ blue means it fell.
The coronavirus gripped the United States by March 2020. The economy halted. Gas prices ↓ plummeted.
This year, things have taken another turn. Gasoline prices have increased sharply, ↑ up 41.8% by July compared with a year earlier.
It’s a similar story for used cars and trucks, with prices ↓ falling during the pandemic shutdown, then ↑ soaring as things reopened.
Tags: finanças, gráficos altor\baixo, gráficos variação, inflação
2020 Census Results
Posted by Armando Brito Mendes | Filed under Data Science, data sets, estatística
Fonte de dados do census dos EUA
Decennial Census P.L. 94-171 Redistricting Data Summary Files
Includes the official data, documentation, and support materials to assist in accessing P.L. 94-171 Redistricting Data.
2020 Census Apportionment Results
On August 12, we released the redistricting data to the states and the public. States may use these data in redrawing congressional, legislative, and local district boundaries. The Census Bureau will also deliver the final redistricting data toolkit to all states and the public by September 30. COVID-19-related delays and prioritizing the delivery of these apportionment results delayed our original plan.
More 2020 Census population results will be available later including statistics on age, sex, race and ethnicity, and details about the center of population. The results for the U.S. Island Areas will also be provided in a separate release at a later date.
Tags: census, dados, população
How Much the Everyday Changes When You Are in a Pandemic
Posted by Armando Brito Mendes | Filed under Data Science, estatística, relatórios, visualização
Um gráfico inovador para mostrar a evolução entre dois pontos no tempo
A comparison of American time use in 2020 versus 2019By Nathan Yau
Our everyday routines changed over the past year, and with the recent data release from the 2020 American Time Use Survey, we can see by how much.
The survey, published by the Bureau of Labor Statistics, asks participants what they did over a 24-hour period. Usually, the survey is ongoing with results published each year, but in 2020, it was suspended from mid-March to mid-May.
Tags: alteração do modo de vida, COVID, tempo
A Pirate’s Favorite Programming Language
Posted by Armando Brito Mendes | Filed under Data Science, estatística
O curioso e divertido ponto de vista de um programador sobre a linguagem R e outras linguages especializadas.
I’d like to understand more about the world of statistics and data science, so I’ve been learning the programming language R. It has wide applications in the sciences (social and natural). There’s an IDE, freely available, called R Studio, which features a very large number of relatively sensible defaults and makes it easy to load up libraries. This meant that I didn’t have to learn much to get started, and had all the software I needed installed and ready to go in a few minutes. There’s also a set of connected libraries called the tidyverse that are obviously a huge improvement on whatever was there before.
Tags: diversão, linguagens de programação, tempos livres
6 Charts That Dismantle The Trope Of Asian Americans As A Model Minority
Posted by Armando Brito Mendes | Filed under Data Science, estatística, relatórios

Um exemplo excelente de um relatório com muito bons gráficos.
“Smart.” “Hard-working.” “Nice.” Those were among the adjectives that respondents offered up in a recent poll when asked to describe Asian Americans.
The poll, conducted by the nonprofit Leading Asian Americans to Unite for Change (LAAUNCH), was another all-too-familiar reminder that Asian Americans are still perceived as the “model minority.”
Since the end of World War II, this myth about Asian Americans and their perceived collective success has been used as a racial wedge — to minimize the role racism plays in the struggles of other minority groups, such as Black Americans.
Characterizing Asian Americans as a model minority flattens the diverse experiences of Asian Americans into a singular, narrow narrative. And it paints a misleading picture about the community that doesn’t align with current statistics.
Here’s a look at some common misconceptions driven by the model minority myth.
Tags: asian people, charts, graphs, USA races
Fat Chance: Writing about Probability
Posted by Armando Brito Mendes | Filed under Data Science, estatística

Bons conselhos sobre como comunicar incerteza, probabilidades e percentagens
Since the COVID-19 pandemic began, almost every choice we have made in our day-to-day lives has required careful consideration of the odds. How dangerous is going to the supermarket at peak time? Is it safe to see friends after getting one vaccine shot? Will children get sick, or spread the virus to others, if they go back to school?
Just the quantity of decisions can be exhausting. But there’s something else making all of these choices so difficult: People, by and large, are bad at probability. We turn high odds into certainties, as when people assume that the accuracy of PCR tests for COVID means they’ll always yield correct results, or when we think of relatively unlikely events, like catching the virus after being fully vaccinated, as impossible. And in between 100 percent certainty and zero chance, the way we interpret any given number can change radically based on how that probability is expressed.
Such glitches in thinking aren’t surprising, says journalist and statistician Regina Nuzzo, a professor of statistics at Gallaudet University in Washington, DC, and a senior advisor for statistics communication and media innovation at the American Statistical Association. “Human brains hate probability, they hate ambiguity, they hate the uncertainty,” she says. “We’re just not wired to deal with this sort of thing very well.”
But for science writers, avoiding uncertainty isn’t an option. “Everything [in science] is quantified by the likelihood or lack of likelihood of it happening,” says science journalist Tara Haelle, who has written extensively about covering statistics for the Association of Health Care Journalists (AHCJ). But as Haelle says, “Humans don’t make decisions that way.” People tend to be far more comfortable with a definitive yes or no, she says, than with the uncharted space in between.
That means science writers have to work hard to coax readers away from those two extremes and toward a more nuanced understanding. “Probability information is crucial to making a really informed decision,” says psychologist Vivianne Visschers, who studies risk communication and decision making at the University of Applied Sciences and Arts Northwestern Switzerland. Without a good understanding of such information, readers may ease up on pandemic social-distancing precautions too early, or avoid a medical examination that they want to have.
There’s no single, straightforward way to write about probability. The very concept can be ambiguous and tricky. But strategies like using analogies, creating visuals, and making careful use of language can help to convey just what a 15 percent chance of an extreme weather event, or an 80 percent chance of recovering from a disease, really means.
Tags: comunicação em ciência, probabilidades
Why Am I Numb To The Numbers?
Posted by Armando Brito Mendes | Filed under Data Science, data sets, estatística, visualização
Sobre a dormência causada pelos grandes números.
COMIC: For My Job, I Check Death Tolls From COVID. Why Am I Numb To The Numbers?
April 25, 20218:16 AM ET
Each week I check the latest deaths from COVID-19 for NPR. After a while, I didn’t feel any sorrow at the numbers. I just felt numb. I wanted to understand why — and how to overcome that numbness.
Tags: Banda Desenhada, big number dumb, psicologia
Send postcards of plots made in R
Posted by Armando Brito Mendes | Filed under estatística, visualização

Muito engraçado este pacote do R
How many times have you made a plot in R and thought, “I wish I could send this as a postcard to my best friend.” Probably a million times, right? Wish no more. The ggirl package (that’s gg-in real life for short) by Jacqueline Nolis lets you send a plot over the internets to a postcard API, which sends a physical card to an address you specify.
Tags: engracado, gráficos, postais
Journal of Physics: Conference Series
Posted by Armando Brito Mendes | Filed under estatística, Investigação Operacional, matemática, refs bibliográficas
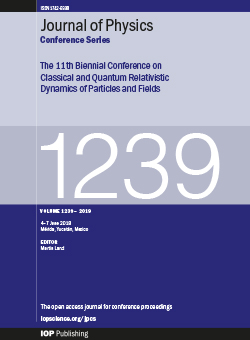
longa lista de artigos resultantes de conferências de Matemática e Física
The open access Journal of Physics: Conference Series (JPCS) provides a fast, versatile and cost-effective proceedings publication service.
Tags: artigos científicos
Posted by Armando Brito Mendes | Filed under estatística

clique na imagem para seguir o link
Bom texto com conclusões exclusivas
1. Re-sampling and Statistical Inference
- Main Result
- Sampling with or without Replacement
- Illustration
- Optimum Sample Size
- Optimum K in K-fold Cross-Validation
- Confidence Intervals, Tests of Hypotheses
2. Generic, All-purposes Algorithm
- Re-sampling Algorithm with Source Code
- Alternative Algorithm
- Using a Good Random Number Generator
3. Applications
- A Challenging Data Set
- Results and Excel Spreadsheet
- A New Fundamental Statistics Theorem
- Some Statistical Magic
- How does this work?
- Does this contradict entropy principles?
4. Conclusions
Tags: data mining, inferência, machine learning