Data Visualization In Excel Using Python
Posted by Armando Brito Mendes | Filed under estatística, lições, materiais ensino, materiais para profissionais, SAD - DSS, software
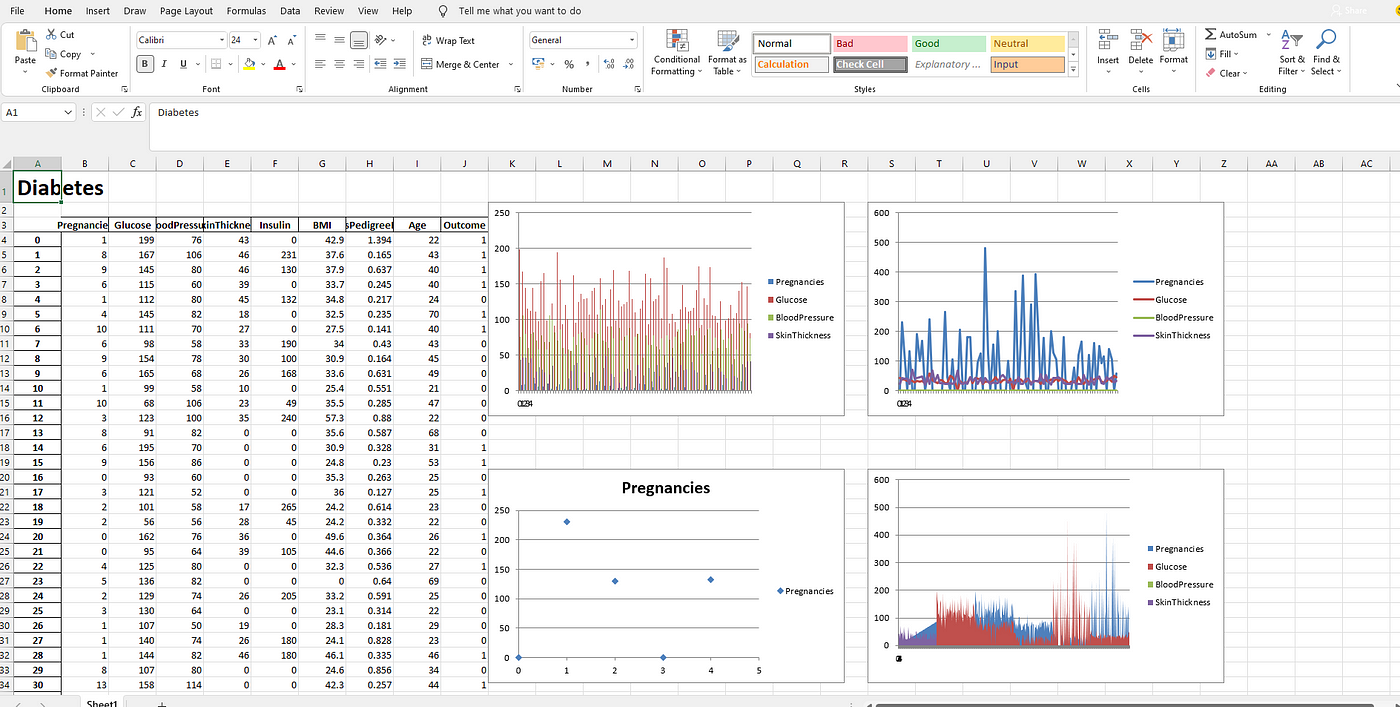
Um pequeno tutorial para utilizar ExcelWriter em Python
Using ExcelWriter for Creating Visualizations in Excel by Python Code
Himanshu Sharma4 days ago·3 min read
Excel is widely used for data analysis and has a lot of functionalities for analyzing, manipulating, visualizing, etc. Using excel should be one of the main skills required for a Data Analyst, Product Analyst, and Business Analyst. It helps in understanding the data and how we can use it for generating useful insights.
Python is also widely used for Data Analysis purposes and also overcomes the drawbacks of Excel. With a little knowledge of Python, we can enhance our Data Analysis skills and also generate more useful insights.
Combining both Excel and Python can be fruitful and makes Data Analysis more interesting. ExcelWriter is used for performing different Excel operations using Python. It provides a wide variety of functionalities like creating an Excel, writing data into an Excel sheet, creating visualizations in Excel, etc.
Tags: dataviz, Excel, Python, visualizações
10 Guidelines for DataViz Accessibility
Posted by Armando Brito Mendes | Filed under Data Science, materiais para profissionais, visualização
10 regras para construir representações de dados mais inclusivas
Introduction
In a world that surrounds us with information at all times, data visualization is increasingly more popular, as a tool to help us make sense of the information, and to grab the attention of users and readers. This has significant implications for the overall accessibility of data. In this article we are exploring the accessibility problems of data visualizations, and how to start solving them.
What is data visualization meant to do?
Before we dive into the accessibility implications of data visualizations, it is useful to consider the value they are meant to provide to the user. This will help us think about how to provide value to all users – including users with various disabilities.
Tags: acessibilidade, dataviz