Data Visualization In Excel Using Python
Posted by Armando Brito Mendes | Filed under estatística, lições, materiais ensino, materiais para profissionais, SAD - DSS, software
Um pequeno tutorial para utilizar ExcelWriter em Python
Using ExcelWriter for Creating Visualizations in Excel by Python Code
Himanshu Sharma4 days ago·3 min read
Excel is widely used for data analysis and has a lot of functionalities for analyzing, manipulating, visualizing, etc. Using excel should be one of the main skills required for a Data Analyst, Product Analyst, and Business Analyst. It helps in understanding the data and how we can use it for generating useful insights.
Python is also widely used for Data Analysis purposes and also overcomes the drawbacks of Excel. With a little knowledge of Python, we can enhance our Data Analysis skills and also generate more useful insights.
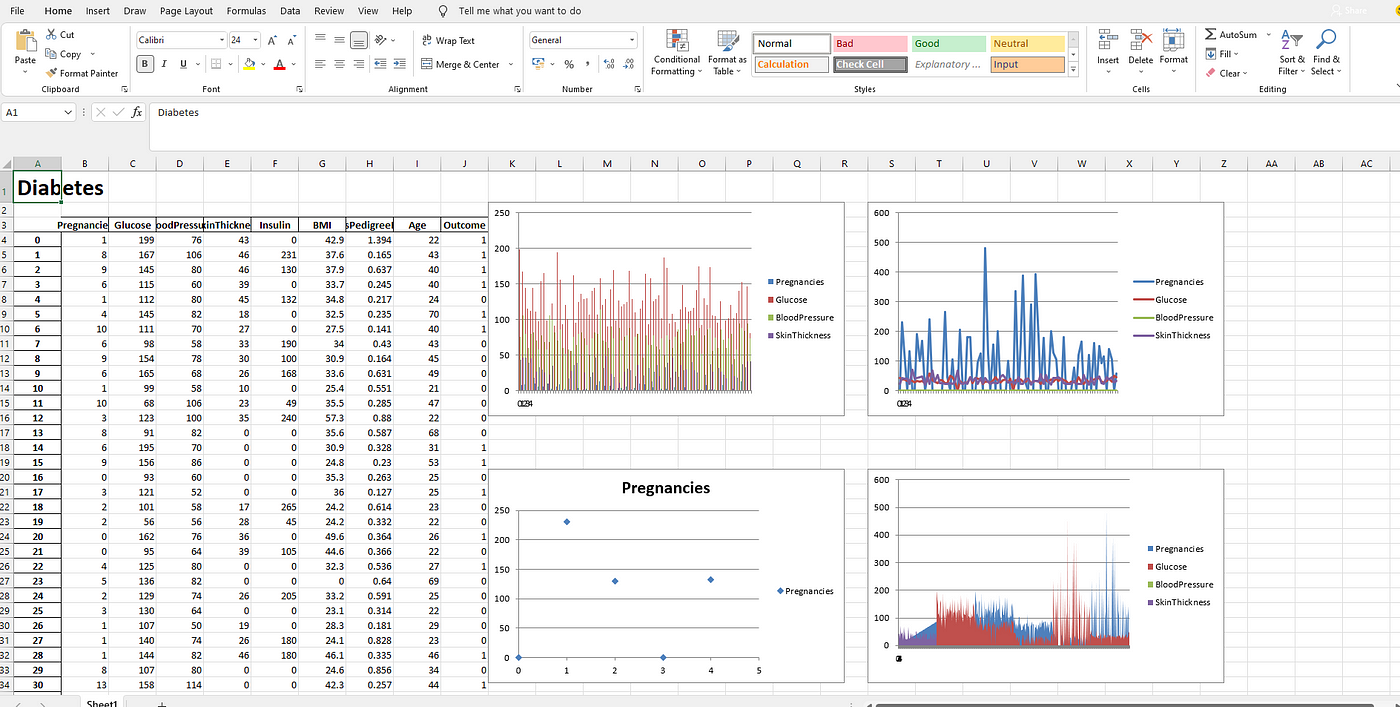
Combining both Excel and Python can be fruitful and makes Data Analysis more interesting. ExcelWriter is used for performing different Excel operations using Python. It provides a wide variety of functionalities like creating an Excel, writing data into an Excel sheet, creating visualizations in Excel, etc.
Tags: dataviz, Excel, Python, visualizações
Comments are closed.