Visualizing a codebase
Posted by Armando Brito Mendes | Filed under software, visualização

Uma forma alternativa de visualizar uma árvore de pastas, com círculos
How can we “fingerprint” a codebase to see its structure at a glance? Let’s explore ways to automatically visualize a GitHub repo, and how that could be useful.WHAT’S IT FOR?“Fingerprint” the structure of a GitHub repoSHARE
Imagine this: you’re looking at a new codebase, and you want to find the code for a specific function.
For example, in the create-react-app codebase,How quickly can you find a test for react-dev-utils?
Tags: círculos, GitHub, visualização
Data Visualization In Excel Using Python
Posted by Armando Brito Mendes | Filed under estatística, lições, materiais ensino, materiais para profissionais, SAD - DSS, software
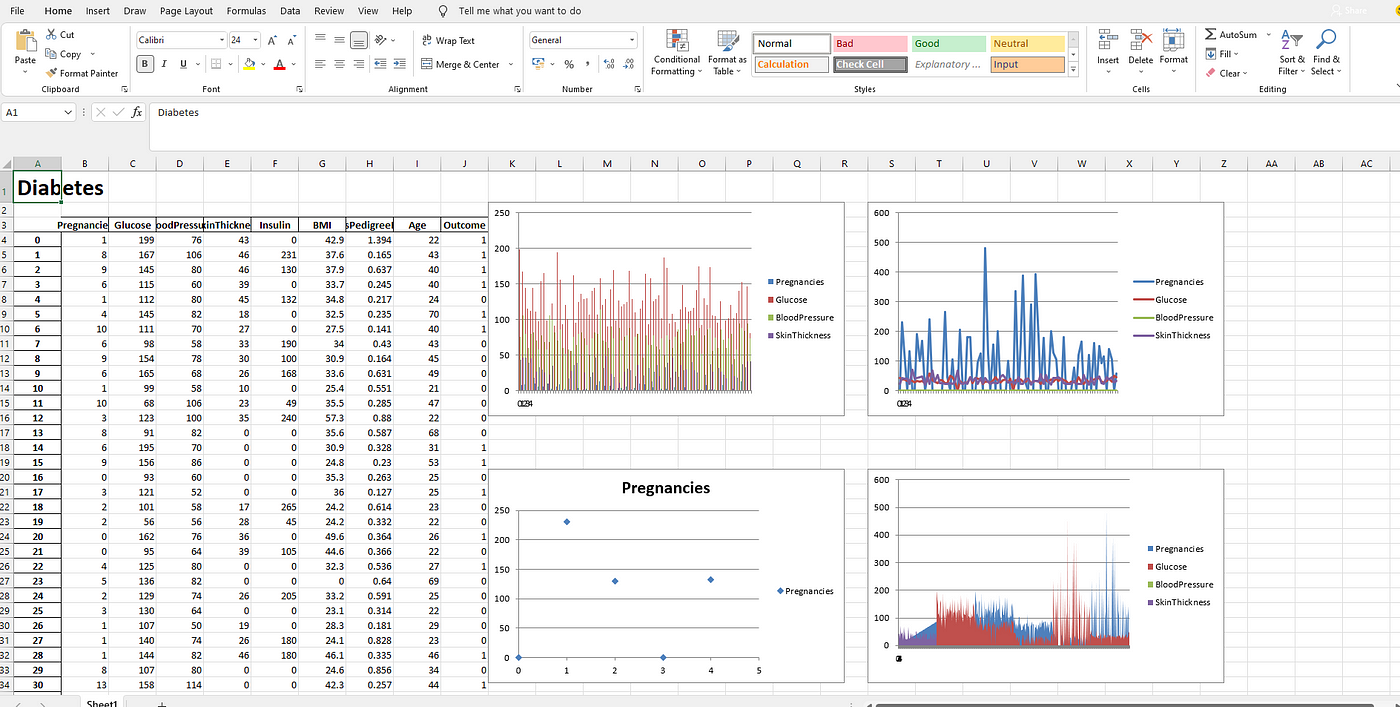
Um pequeno tutorial para utilizar ExcelWriter em Python
Using ExcelWriter for Creating Visualizations in Excel by Python Code
Himanshu Sharma4 days ago·3 min read
Excel is widely used for data analysis and has a lot of functionalities for analyzing, manipulating, visualizing, etc. Using excel should be one of the main skills required for a Data Analyst, Product Analyst, and Business Analyst. It helps in understanding the data and how we can use it for generating useful insights.
Python is also widely used for Data Analysis purposes and also overcomes the drawbacks of Excel. With a little knowledge of Python, we can enhance our Data Analysis skills and also generate more useful insights.
Combining both Excel and Python can be fruitful and makes Data Analysis more interesting. ExcelWriter is used for performing different Excel operations using Python. It provides a wide variety of functionalities like creating an Excel, writing data into an Excel sheet, creating visualizations in Excel, etc.
Tags: dataviz, Excel, Python, visualizações
aRtsy: Generative Art with R and ggplot2
Posted by Armando Brito Mendes | Filed under linguagens de programação, materiais ensino, materiais para profissionais, software, visualização

Um pacote para o R para criar arte generativa
“If you laugh at a joke, what difference does it make if subsequently you are told that the joke was created by an algorithm?” – Marcus du Sautoy, The Creative Code
aRtsy is an attempt at making generative art available for the masses in a simple and standardized format. The package provides various algorithms for creating artworks in ggplot2 that incorporate some form of randomness (depending on the set seed). Each type of artwork is implemented in a separate function.
Good luck hunting for some good seed’s! Feel free to post a comment with your best artworks and the corresponding seed in the GitHub discussions.
Contributions to aRtsy are very much appreciated! If you want to add your own type of artwork to the package so that others can also create them, feel free to make a pull request to the GitHub repository. Don’t forget to adjust generate-artwork.R if you also want the artwork to show up in the ‘Artwork of the day’ category and the twitter feed.
spatula for writing maintainable web scrapers
Posted by Armando Brito Mendes | Filed under Data Science, data sets, software

Boa biblioteca Python para web scraping
spatula is a modern Python library for writing maintainable web scrapers.
Source: https://github.com/jamesturk/spatula
Documentation: https://jamesturk.github.io/spatula/
Issues: https://github.com/jamesturk/spatula/issues
how you can use the JavaScript library React with D3.js
Posted by Armando Brito Mendes | Filed under materiais para profissionais, software, visualização
Bom tutorial para o uso das tecnologias de visualização de dados.
React.js is a JavaScript library that helps with building complex user interfaces. This website is written using React!
I would recommend being familiar with React for this article. It might be worth running through the official tutorial or running through a book (I’ve heard good things about this one) to make sure you don’t stumble on anything in here!
Tags: D3.js, java script, react
API Integration in Python
Posted by Armando Brito Mendes | Filed under linguagens de programação, materiais para profissionais, software
able of Contents
- How to Make Friends and Influence APIs
- Talking REST
- Constructing an API Library
- Coming in Part 2
- Appendix: REST in a nutshell
A Beginner’s Guide to learn web scraping with python!
Posted by Armando Brito Mendes | Filed under lições, materiais ensino, materiais para profissionais, software

Boa descrição de web scraping com Python
Web Scraping with Python
Imagine you have to pull a large amount of data from websites and you want to do it as quickly as possible. How would you do it without manually going to each website and getting the data? Well, “Web Scraping” is the answer. Web Scraping just makes this job easier and faster.
In this article on Web Scraping with Python, you will learn about web scraping in brief and see how to extract data from a website with a demonstration. I will be covering the following topics:
Tags: Python
Build Pipelines with Pandas Using pdpipe
Posted by Armando Brito Mendes | Filed under linguagens de programação, software

Boa descrição de pipelines com os data.frame do Pandas.
Pandas is an amazing library in the Python ecosystem for data analytics and machine learning. They form the perfect bridge between the data world, where Excel/CSV files and SQL tables live, and the modeling world where Scikit-learn or TensorFlow perform their magic.
A data science flow is most often a sequence of steps — datasets must be cleaned, scaled, and validated before they can be ready to be used by that powerful machine learning algorithm.
These tasks can, of course, be done with many single-step functions/methods that are offered by packages like Pandas but a more elegant way is to use a pipeline. In almost all cases, a pipeline reduces the chance of error and saves time by automating repetitive tasks.
In the data science world, great examples of packages with pipeline features are — dplyr in R language, and Scikit-learn in the Python ecosystem.
A data science flow is most often a sequence of steps — datasets must be cleaned, scaled, and validated before they can be ready to be used
Following is a great article about their use in a machine-learning workflow.
Managing Machine Learning Workflows with Scikit-learn Pipelines Part 1: A Gentle Introduction
Are you familiar with Scikit-learn Pipelines? They are an extremely simple yet very useful tool for managing machine…
Pandas also offer a .pipe method which can be used for similar purposes with user-defined functions. However, in this article, we are going to discuss a wonderful little library called pdpipe, which specifically addresses this pipelining issue with Pandas DataFrame.
In almost all cases, a pipeline reduces the chance of error and saves time by automating repetitive tasks
Tags: data mining, pandas, pipelines, Python
imagens criadas por campos vetoriais
Posted by Armando Brito Mendes | Filed under materiais ensino, software, visualização

This website allows you to explore vector fields in real time.
“Vector field” is just a fancy way of saying that each point on a screen has some vector associated with it. This vector could mean anything, but for our purposes we consider it to be a velocity vector.
Now that we have velocity vectors at every single point, let’s drop thousands of small particles and see how they move. Resulting visualization could be used by scientist to study vector fields, or by artist to get inspiration!
Learn more about this project on GitHub
Stay tuned for updates on Twitter.
With passion,
Anvaka
Tags: belo
Free Hadoop Tutorial: Master BigData
Posted by Armando Brito Mendes | Filed under lições, materiais ensino, software

clique na imagem para seguir o link
BigData is the latest buzzword in the IT Industry. Apache’s Hadoop is a leading Big Data platform used by IT giants Yahoo, Facebook & Google. This course is geared to make a Hadoop Expert.
What should I know?
This is an absolute beginner guide to Hadoop. But knowledge of 1) Java 2) Linux will help
Syllabus
| Tutorial | Introduction to BIG DATA: Types, Characteristics & Benefits |
| Tutorial | Hadoop Tutorial: Features, Components, Cluster & Topology |
| Tutorial | Hadoop Setup Tutorial – Installation & Configuration |
| Tutorial | HDFS Tutorial: Read & Write Commands using Java API |
| Tutorial | What is MapReduce? How it Works – Hadoop MapReduce Tutorial |
| Tutorial | Hadoop & Mapreduce Examples: Create your First Program |
| Tutorial | Hadoop MapReduce Tutorial: Counters & Joins with Example |
| Tutorial | What is Sqoop? What is FLUME – Hadoop Tutorial |
| Tutorial | Sqoop vs Flume vs HDFS in Hadoop |
| Tutorial | Create Your First FLUME Program – Beginner’s Tutorial |
| Tutorial | Hadoop PIG Tutorial: Introduction, Installation & Example |
| Tutorial | Learn OOZIE in 5 Minutes – Hadoop Tutorial |
| Tutorial | Big Data Testing: Functional & Performance |
| Tutorial | Hadoop & MapReduce Interview Questions & Answers |
Tags: big data