Over 18,000 annual ER visits linked to Christmas decor incidents
Posted by Armando Brito Mendes | Filed under Data Science, visualização

Bons exemplos de gráficos de linhas
Every year, around 18,400 people[1] visit emergency rooms because of accidents with Christmas decorations. The peak day for these mishaps is usually the Sunday after Thanksgiving, when an annual average of 660 people seek medical attention for their injuries.
Tags: gráficos de linhas, histogramas, urgências
Attitudes towards tipping in the U.S.
Posted by Armando Brito Mendes | Filed under Data Science, estatística, visualização
um exemplo de utilização de pirâmide de idades (com barras acumuladas) noutro contexto
Tipping seems to be in a confusing spot right now. On the one hand, customers want to support workers, but on the other, tip suggestions seem to be rising towards uncomfortable rates and in places where people don’t usually tip. Pew Research surveyed 12,000 U.S. adults to see how we’re all feeling about the current state of tipping.
Tags: barras acumuladas, gorgetas, pirâmide de idades
Most Common Jobs, by Income Group
Posted by Armando Brito Mendes | Filed under Data Science, visualização
Um gráfico de medianas com bolhas
By Nathan Yau
What jobs typically pay over $200,000 in annual salary? What about jobs that pay at least six-figure incomes? These are income ranges for the ten most common jobs at different income levels.
Tags: emprego, gráfico de bolhas, gráfico de medianas
Menstrual cycle length and variability: a visual explanation
Posted by Armando Brito Mendes | Filed under Data Science, visualização

uma boa estória, com boas ilustrações animadas e gráficas
A person’s menstrual cycle length and regularity are key indicators of their overall health. The Apple Women’s Health Study (AWHS ) is helping us characterize menstrual cycles throughout people’s lives, by enrolling study participants who provide their permission for us to collect and analyze data on a larger scale than ever before. This understanding can help people prepare for their menstrual cycles and help patients and clinicians personalize their healthcare.
In Part 1: What is a menstrual cycle?, we define and explain key characteristics of a menstrual cycle. In Part 2: How long is a typical cycle?, we explore the range of cycle lengths of people from the study. In Part 3: What is an irregular cycle?, we look at how much a person’s cycle varies from month to month. Finally, in Part 4: What determines cycle characteristics?, we discuss why we see variation in cycle characteristics through a person’s life, and why it’s important for everyone to understand these changes so that we can better prepare for them.
Tags: animação, gráficos, menstruação
What This Graph of a Dinosaur Can Teach Us about Doing Better Science
Posted by Armando Brito Mendes | Filed under Data Science, estatística, visualização

um texto muito bom sobre visualização de dados
“Anscombe’s quartet” and the “datasaurus dozen” demonstrate the importance of visualizing data
- By Jack Murtagh on September 7, 2023
Mark Twain once wrote, “There are three kinds of lies: lies, damned lies, and statistics.” (He attributed the quip to former British prime minister Benjamin Disraeli, but its true origin is unknown.) Given the foundational importance of statistics in modern science, this quote paints a bleak picture of the scientific endeavor. Thankfully, several generations of scientific progress have proved Twain’s sentiment to be an exaggeration. Still, we shouldn’t discard the wisdom in those words. While statistics is an essential tool for understanding the world, employing it responsibly and avoiding its pitfalls requires a delicate dance.
Tags: gráficos, visualização, visualizações
Why Momentum Really Works
Posted by Armando Brito Mendes | Filed under Data Science, infogramas \ dashboards, materiais ensino
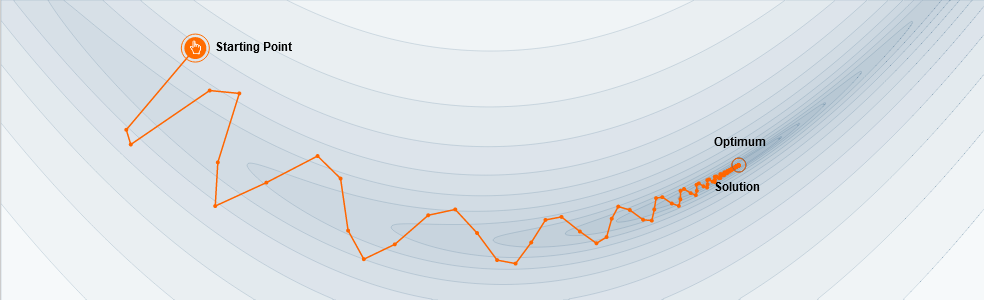
Uma excelente explicação de como funciona o momentum em redes neuronais
Here’s a popular story about momentum [1, 2, 3]: gradient descent is a man walking down a hill. He follows the steepest path downwards; his progress is slow, but steady. Momentum is a heavy ball rolling down the same hill. The added inertia acts both as a smoother and an accelerator, dampening oscillations and causing us to barrel through narrow valleys, small humps and local minima.
This standard story isn’t wrong, but it fails to explain many important behaviors of momentum. In fact, momentum can be understood far more precisely if we study it on the right model.
One nice model is the convex quadratic. This model is rich enough to reproduce momentum’s local dynamics in real problems, and yet simple enough to be understood in closed form. This balance gives us powerful traction for understanding this algorithm.
Tags: aprendizagem, deep learning, ML, RNA
figshare – a home for research outputs
Posted by Armando Brito Mendes | Filed under Data Science, data sets, estatística

Uma excelente fonte de dados e estudos
the repository built to showcase all of your institution’s research outputs in one place
Tags: dados, data, estudos, research
Where is there more livestock than people?
Posted by Armando Brito Mendes | Filed under Data Science, data sets, mapas SIG's, visualização

Continuing my investigation of the USDA Quickstats site I first used here…
Notes on inspiration
I was first inspired to do this piece when I saw these analogous maps for France:
I figured that the USDA data I’d already been digging into had to have the data for the USA, and in fact, it did!
The data has holes in it–a county may appear one year but not the next. I got around this by using the most recent post-2010 data available for each county+animal type. When comparing these values to the human population, I made sure to use the ACS data for that same year.
The aesthetics came together very quickly. I considered doing the thing as Jules Grandin and keeping the maps ultra simple, but ultimately couldn’t resist showing the animal:human ratios instead of just which counties had more animals.
The first map ended up scratching that “ultra simple” itch, but with a bit of a twist. I chose not to show ratios in that one because it already has so much going on–I think adding in gradients of color just would have made it hard to read. I’m also quite proud of my venn diagram legend there!
Tags: animais, Estat Descritiva, mapas
Midterm elections 2022: The issues that matter to Americans
Posted by Armando Brito Mendes | Filed under Data Science, estatística, infogramas \ dashboards, mapas SIG's, Sem categoria, visualização

Uma boa análise dos termos mais pesquisados por região nos EUA, com mapas.
As the 2022 midterms approach, see which issues people in your congressional district care about
All politics are local.
To identify the most decisive issues for this year’s midterm voters, Axios dug through Google Trends search data in each congressional district.
We are tracking two trends:
- Absolute interest, which ranks the topics people are Googling most in their districts.
- Relative interest, which compares the interest in a topic from one district to another.
For example, people in Montana’s 2nd Congressional District have been searching about “jobs” less frequently than people in most other districts. The topic has low relative interest there. But in the same district, people search “jobs” more than any other topic listed. So “jobs” still comes in as No. 1 for absolute interest.
You can learn more about how we measure absolute interest and relative interest below or scroll down to explore the results on your own.
Tags: EUA, google, termos pesquisados
How Much Time We Spend Alone and With Others
Posted by Armando Brito Mendes | Filed under Data Science, relatórios, visualização

uma simulação do tempo q passamos com outros durante o dia ilustrada com gráficos de pontos em movimento e gráficos de barras acumuladas.
By Nathan Yau
Oftentimes what we’re doing isn’t so important as who we’re spending our time with. The chart below, based on data from the American Time Use Survey, shows a simulated day for 100 people.
TIME SPENT WITH OTHERS DURING A SINGLE DAY
A simulation of a weekday. Each dot represents a person.
Tags: simulação, single day, tempo de vida