How Men and Women Spend Their Days
Posted by Armando Brito Mendes | Filed under Data Science, estatística, relatórios, visualização

Um bom exemplo de gráficos de linhas acumuladas ou gráfico de diferenças
By Nathan Yau
For the employed, unemployed, and those not in the labor force, the charts below show the percentage of people doing an activity over a day in 2020. Switch between a weekday or a weekend day. Select activities to see individually.
Tags: análise de dados, belo, Estat Descritiva, homens e mulheres, ocupação
The pandemic marks another grim milestone: 1 in 500 Americans have died of covid-19
Posted by Armando Brito Mendes | Filed under estatística, relatórios, visualização

Um bom exemplo da utilização de valores relativos em vez de valores absolutos
By Dan Keating, Akilah Johnson and Monica Ulmanu Updated Sept. 15 at 9:00 a.m.Originally published Sept. 15, 20210
At a certain point, it was no longer a matter of if the United States would reach the gruesome milestone of 1 in 500 people dying of covid-19, but a matter of when. A year? Maybe 15 months? The answer: 19 months.
Given the mortality rate from covid and our nation’s population size, “we’re kind of where we predicted we would be with completely uncontrolled spread of infection,” said Jeffrey D. Klausner, clinical professor of medicine, population and public health sciences at the University of Southern California’s Keck School of Medicine. “Remember at the very beginning, which we don’t hear about anymore, it was all about flatten the curve.”
Tags: covid-19, Estat Descritiva, EUA
Olympians are probably older — and younger — than you think
Posted by Armando Brito Mendes | Filed under Data Science, estatística, relatórios, visualização
Um relatório com vários gráficos tipos histogramas unidimensionais (gráficos de pontos)
There were some outliers in the old days, but even in Tokyo, athletes range from boomers through Gen Z
By Bonnie Berkowitz andArtur Galocha July 31
As you would expect, two-thirds of the roughly 11,700 Olympians competing in Tokyo are in their 20s. Prime of life, blah blah blah.
But the rest of the athletes range from two preteens to four 60-somethings, and the older competitors nudged up the average age to 27 for the first time since 1948.
Since the first modern Olympics in 1896, the wide range of sports has allowed for a wide range of sportsmen — and sportswomen, beginning in 1900.
A 10-year-old boy competed in that first Games, and several septuagenarians have suited up. (A 98-year-old sort of competed in 1928, but whether he counts is debatable because he was entered in the art competition and also was dead.)
Tags: gráfico de pontos, idades, olimpiadas
Visualizing a codebase
Posted by Armando Brito Mendes | Filed under software, visualização

Uma forma alternativa de visualizar uma árvore de pastas, com círculos
How can we “fingerprint” a codebase to see its structure at a glance? Let’s explore ways to automatically visualize a GitHub repo, and how that could be useful.WHAT’S IT FOR?“Fingerprint” the structure of a GitHub repoSHARE
Imagine this: you’re looking at a new codebase, and you want to find the code for a specific function.
For example, in the create-react-app codebase,How quickly can you find a test for react-dev-utils?
Tags: círculos, GitHub, visualização
See how California changed in the last decade, right down to your neighborhood
Posted by Armando Brito Mendes | Filed under Data Science, relatórios, visualização

Um relatório com vários tipos de gráficos de comparação das etnias em duas datas distintas
The demographics of California’s communities are changing quickly. Take Alameda County. Today, the share of people who identify as Asian make up 32% of Alameda County — the county’s largest single demographic group. In 2010, that figure was 27%. White people made up 34% of the county back then. Now they are just 28%.
Scroll down to plug in your address to see how your community has changed
Tags: comparação, demografia, gráficos variação
Repulsive Curves
Posted by Armando Brito Mendes | Filed under materiais para profissionais, refs bibliográficas, visualização

Um trabalho muito interessante e com muito código sobre os melhores algoritmos para construir curvas que não se sobrepõem
Curves play a fundamental role across computer graphics, physical simulation, and mathematical visualization, yet most tools for curve design do nothing to prevent crossings or self-intersections. This paper develops efficient algorithms for (self-)repulsion of plane and space curves that are well-suited to problems in computational design. Our starting point is the so-called tangent-point energy, which provides an infinite barrier to self-intersection. In contrast to local collision detection strategies used in, e.g., physical simulation, this energy considers interactions between all pairs of points, and is hence useful for global shape optimization: local minima tend to be aesthetically pleasing, physically valid, and nicely distributed in space. A reformulation of gradient descent, based on a Sobolev-Slobodeckij inner product enables us to make rapid progress toward local minima—independent of curve resolution. We also develop a hierarchical multigrid scheme that significantly reduces the per-step cost of optimization. The energy is easily integrated with a variety of constraints and penalties (e.g., inextensibility, or obstacle avoidance), which we use for applications including curve packing, knot untangling, graph embedding, non-crossing spline interpolation, flow visualization, and robotic path planning.
Data Visualization In Excel Using Python
Posted by Armando Brito Mendes | Filed under estatística, lições, materiais ensino, materiais para profissionais, SAD - DSS, software
Um pequeno tutorial para utilizar ExcelWriter em Python
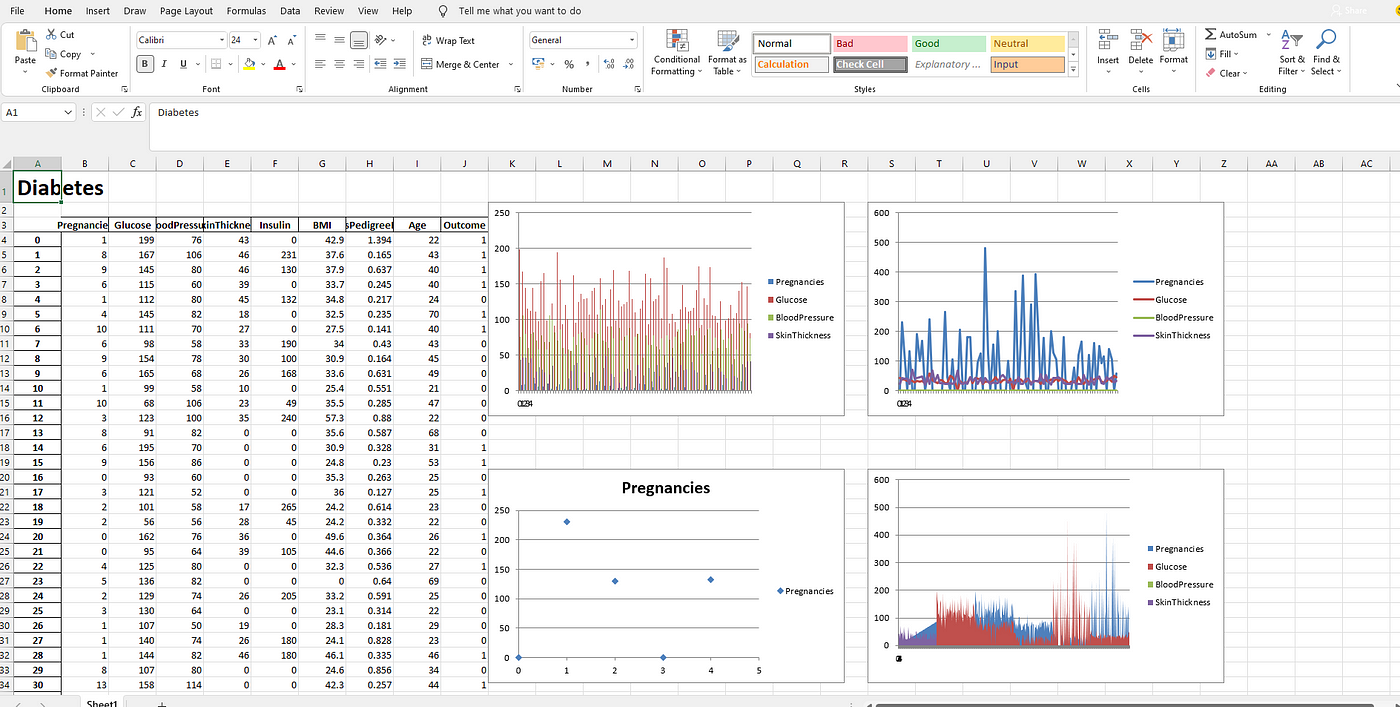
Using ExcelWriter for Creating Visualizations in Excel by Python Code
Himanshu Sharma4 days ago·3 min read
Excel is widely used for data analysis and has a lot of functionalities for analyzing, manipulating, visualizing, etc. Using excel should be one of the main skills required for a Data Analyst, Product Analyst, and Business Analyst. It helps in understanding the data and how we can use it for generating useful insights.
Python is also widely used for Data Analysis purposes and also overcomes the drawbacks of Excel. With a little knowledge of Python, we can enhance our Data Analysis skills and also generate more useful insights.
Combining both Excel and Python can be fruitful and makes Data Analysis more interesting. ExcelWriter is used for performing different Excel operations using Python. It provides a wide variety of functionalities like creating an Excel, writing data into an Excel sheet, creating visualizations in Excel, etc.
Tags: dataviz, Excel, Python, visualizações
A Better Way for Data Preprocessing: Pandas Pipe
Posted by Armando Brito Mendes | Filed under Data Science, lições, linguagens de programação, materiais ensino, materiais para profissionais

Um pequeno tutorial sobre como começar a usar o pipe
Efficient, organized, and elegant.
Soner YıldırımJul 31·4 min read
Real-life data is usually messy. It requires a lot of preprocessing to be ready for use. Pandas being one of the most-widely used data analysis and manipulation libraries offers several functions to preprocess the raw data.
In this article, we will focus on one particular function that organizes multiple preprocessing operations into a single one: the pipe function.
When it comes to software tools and packages, I learn best by working through examples. I keep this in mind when creating content. I will do the same in this article.
Tags: pipe, préprocessamento, Python
Cycle of Many
Posted by Armando Brito Mendes | Filed under relatórios, visualização
uma representação original, circular, de um dia na vida dos americanos
By Nathan Yau
This is a 24-hour snapshot for a day in the life of Americans. Each ring represents an activity with a color. More dots means a greater percentage of people doing the respective activity during a certain time of day.
If you start at the top of the circle, you’ll be at 9:00am when most people who work are already working. Move clockwise, and you see the flows of the day. People break for lunch at noon, get off work around 5:00pm, shift to dinner and then relax. Most people are sleeping by midnight but a small percentage of people are work at night.
Focus on the inside rings versus the outer rings for a rough comparison between work life and home life, each with its own responsibilities.
Source
The data comes from the American Time Use Survey 2020, which is run by the Bureau of Labor Statistics. I downloaded microdata via IPUMS.
Tags: 24h, gráficos, time, uso do tempo
THREE RESOURCES TO STUDY TIME USE
Posted by Armando Brito Mendes | Filed under data sets

Boa fonte de dados sem custo.
IPUMS provides census and survey data from around the world integrated across time and space. IPUMS integration and documentation makes it easy to study change, conduct comparative research, merge information across data types, and analyze individuals within family and community contexts. Data and services available free of charge.