Why Momentum Really Works
Posted by Armando Brito Mendes | Filed under Data Science, infogramas \ dashboards, materiais ensino
Uma excelente explicação de como funciona o momentum em redes neuronais
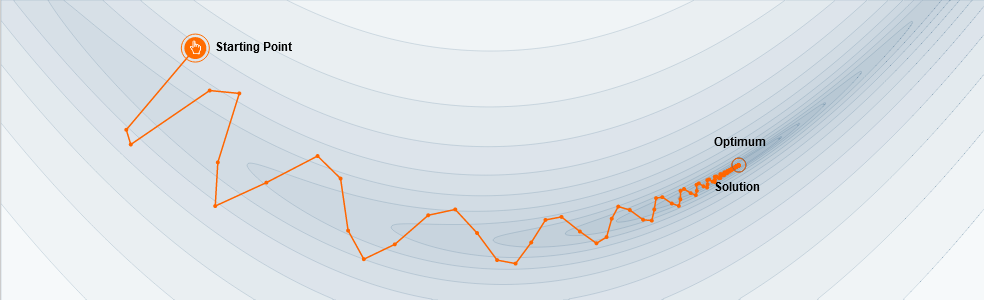
Here’s a popular story about momentum [1, 2, 3]: gradient descent is a man walking down a hill. He follows the steepest path downwards; his progress is slow, but steady. Momentum is a heavy ball rolling down the same hill. The added inertia acts both as a smoother and an accelerator, dampening oscillations and causing us to barrel through narrow valleys, small humps and local minima.
This standard story isn’t wrong, but it fails to explain many important behaviors of momentum. In fact, momentum can be understood far more precisely if we study it on the right model.
One nice model is the convex quadratic. This model is rich enough to reproduce momentum’s local dynamics in real problems, and yet simple enough to be understood in closed form. This balance gives us powerful traction for understanding this algorithm.
Tags: aprendizagem, deep learning, ML, RNA
The floor is lava
Posted by Armando Brito Mendes | Filed under infogramas \ dashboards, materiais ensino, Sem categoria

Um excelente infograma sobre a dissipação do calor no solo humanizado ou natural
How concrete, asphalt and urban heat islands add to the misery of heat waves
PUBLISHED JULY 31, 2023 15:40 AZOST
It only takes just a fraction of a second to suffer a pretty serious burn. Asphalt and concrete in direct sunlight can often reach surface temperatures as high as 82 Celsius (180 Fahrenheit) on the hottest days, said Dr. Kevin Foster, who directs the Arizona Burn Center in Phoenix.
Forecasters predict another heat wave in Phoenix this week after the U.S. National Weather Service declared the city had sweltered under high temperatures above 43°C (115°F) for 30 consecutive days in July. Across Europe, high temperature records have tumbled this summer and major heat waves in much of the world are expected to persist through August.
Tags: animações, calor, infograma
the pudding
Posted by Armando Brito Mendes | Filed under materiais ensino, materiais para profissionais, visualização

Um bom exemplo de uma história bem contada, neste caso, sonora.
Hola y bienvenido.
This is an audio/visual story exploring the sounds of Mexico City’s streets.
To begin, please connect headphones and choose a language.
Lotteries, Covid, and Communicating Risk
Posted by Armando Brito Mendes | Filed under estatística, lições, matemática, materiais ensino

Uma boa tentativa de explicar o conceito de risco de forma simples
Wayne Oldford
May 1, 2022
Two sides of the same coin?
A few years ago, I was the “go to guy” at the University of Waterloo, asked to speak to local media, whenever a lottery jackpot got stupendously large (and the news cycle got exceedingly slow). My purpose was to relate to their audience the size of the chance of winning in a way that was quick yet comprehensible, which I did with some success on local radio and television stations.
Inevitably, though, the next day I would hear back of listener disappointment – that some of the fun of purchasing a ticket had been removed. Joy came from anticipating winning the prize and my exposition killed that for many, by them having gained an appreciation of the chance of actually winning.
I felt a little bit bad about this. I wanted people to understand the probabilities but I didn’t want to be a kill joy.
Tags: probabilidades, risco
Linux Commands Cheat Sheet
Posted by Armando Brito Mendes | Filed under lições, linguagens de programação, materiais ensino, materiais para profissionais
Uma boa cábula dos comandos Linux principais.
Hitesh J Last Updated : 12/13/2021
There are hundreds – possibly thousands – commands available in Linux. Remembering every command is not possible and it can be quite daunting for a novice user. The good news is that you don’t need to remember each command. Only a very small subset of those commands are used on a day-to-day basis.
This cheat sheet offers a set of commands that you can use for quick reference. I have prepared this Linux Commands Cheat Sheet as quick reference for both experienced and basic users.
Tags: informática, Linux
Data Quality for AI
Posted by Armando Brito Mendes | Filed under Data Science, materiais ensino, materiais para profissionais

Uma página da IBM com vários recursos sobre o pré-processamento e avaliação da qualidade dos dados.
This Data Quality for AI (or DQAI, for short) framework of services provides all the tools to enable model developers and data scientists to implement a formalized and systematic program of data preparation, the preliminary and most time consuming step of the model development lifecycle. This framework is appropriate for data being readied for supervised classification or regression tasks. It includes the necessary software to:
— implement quality checks,
— execute remediation,
— generate audit reports,
— automate all the above.
While pipe-lining of tasks is essential for scalability and repeatability, the included capabilities can also be used for custom data exploration and human-guided improvement of models. Utilization of the included services can be productive at any stage in the model development lifecycle, the offering is designed to be especially valuable early in the data processing, in the data preparation stage.
In addition to all that can be accomplished on original data sources, there are methods that, starting from an input dataset, can help synthesize new data — either for supplementation or for replacement — by learning constraints in the original data or having them specified by a developer. This can be helpful when regulatory or contractual issues prohibit direct usage of data in a modeling effort, when it is desirable to explore datasets with different constraints, or when more data is needed for training.
This offering is appropriate for use on both tabular and time series data and new supported modalities being developed.
Tags: data, data preparation, data quality
Explained Visually
Posted by Armando Brito Mendes | Filed under Data Science, estatística, matemática, materiais ensino, visualização

Boas explicações visuais iterativas de conceitos de ML e matemática
Ordinary Least Squares Regression
EV 9 – 2015/02/12
Principal Component Analysis
Axis of easy.
EV 8 – 2015/01/29
Image Kernels
EV 6 – 2015/01/20
Eigenvectors and Eigenvalues
EV 5 – 2014/11/28
Pi (π)
EV 4 – 2014/11/21
Sine and Cosine
EV 3 – 2014/11/14
Exponentiation
EV 2 – 2014/11/07
Markov Chains
Mark on, Markov EV 1 – 2014/10/30 Conditional probability You probably wouldn’t understand.
Tags: análise de dados, ensino
Data Visualization In Excel Using Python
Posted by Armando Brito Mendes | Filed under estatística, lições, materiais ensino, materiais para profissionais, SAD - DSS, software
Um pequeno tutorial para utilizar ExcelWriter em Python
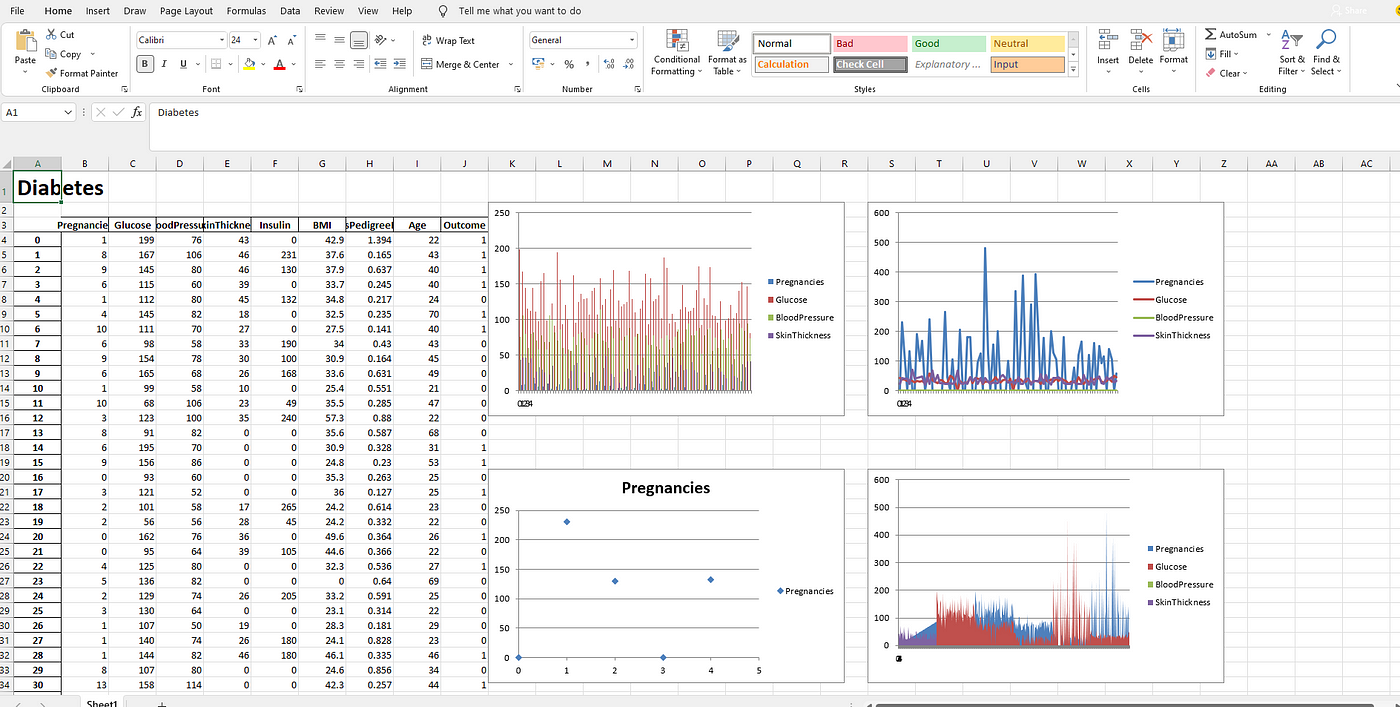
Using ExcelWriter for Creating Visualizations in Excel by Python Code
Himanshu Sharma4 days ago·3 min read
Excel is widely used for data analysis and has a lot of functionalities for analyzing, manipulating, visualizing, etc. Using excel should be one of the main skills required for a Data Analyst, Product Analyst, and Business Analyst. It helps in understanding the data and how we can use it for generating useful insights.
Python is also widely used for Data Analysis purposes and also overcomes the drawbacks of Excel. With a little knowledge of Python, we can enhance our Data Analysis skills and also generate more useful insights.
Combining both Excel and Python can be fruitful and makes Data Analysis more interesting. ExcelWriter is used for performing different Excel operations using Python. It provides a wide variety of functionalities like creating an Excel, writing data into an Excel sheet, creating visualizations in Excel, etc.
Tags: dataviz, Excel, Python, visualizações
A Better Way for Data Preprocessing: Pandas Pipe
Posted by Armando Brito Mendes | Filed under Data Science, lições, linguagens de programação, materiais ensino, materiais para profissionais

Um pequeno tutorial sobre como começar a usar o pipe
Efficient, organized, and elegant.
Soner YıldırımJul 31·4 min read
Real-life data is usually messy. It requires a lot of preprocessing to be ready for use. Pandas being one of the most-widely used data analysis and manipulation libraries offers several functions to preprocess the raw data.
In this article, we will focus on one particular function that organizes multiple preprocessing operations into a single one: the pipe function.
When it comes to software tools and packages, I learn best by working through examples. I keep this in mind when creating content. I will do the same in this article.
Tags: pipe, préprocessamento, Python
aRtsy: Generative Art with R and ggplot2
Posted by Armando Brito Mendes | Filed under linguagens de programação, materiais ensino, materiais para profissionais, software, visualização

Um pacote para o R para criar arte generativa
“If you laugh at a joke, what difference does it make if subsequently you are told that the joke was created by an algorithm?” – Marcus du Sautoy, The Creative Code
aRtsy is an attempt at making generative art available for the masses in a simple and standardized format. The package provides various algorithms for creating artworks in ggplot2 that incorporate some form of randomness (depending on the set seed). Each type of artwork is implemented in a separate function.
Good luck hunting for some good seed’s! Feel free to post a comment with your best artworks and the corresponding seed in the GitHub discussions.
Contributions to aRtsy are very much appreciated! If you want to add your own type of artwork to the package so that others can also create them, feel free to make a pull request to the GitHub repository. Don’t forget to adjust generate-artwork.R if you also want the artwork to show up in the ‘Artwork of the day’ category and the twitter feed.