Data Visualization In Excel Using Python
Posted by Armando Brito Mendes | Filed under estatística, lições, materiais ensino, materiais para profissionais, SAD - DSS, software
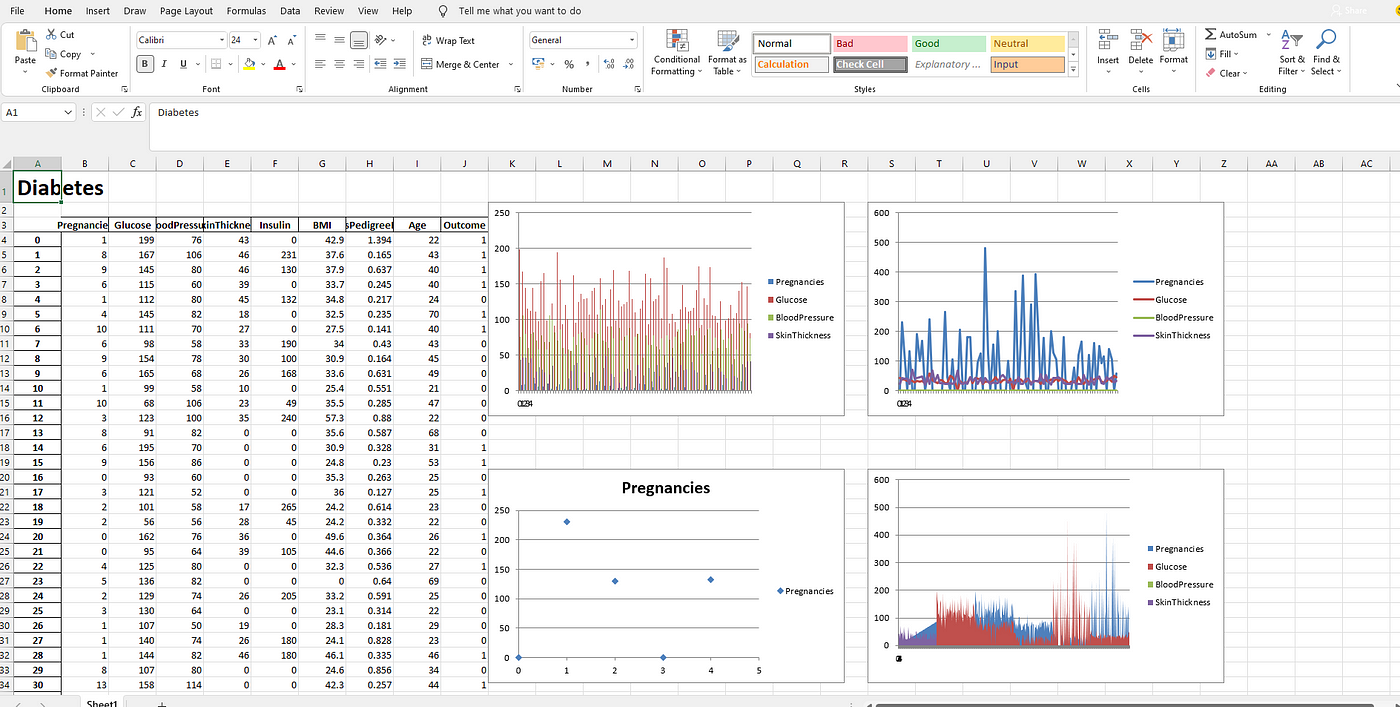
Um pequeno tutorial para utilizar ExcelWriter em Python
Using ExcelWriter for Creating Visualizations in Excel by Python Code
Himanshu Sharma4 days ago·3 min read
Excel is widely used for data analysis and has a lot of functionalities for analyzing, manipulating, visualizing, etc. Using excel should be one of the main skills required for a Data Analyst, Product Analyst, and Business Analyst. It helps in understanding the data and how we can use it for generating useful insights.
Python is also widely used for Data Analysis purposes and also overcomes the drawbacks of Excel. With a little knowledge of Python, we can enhance our Data Analysis skills and also generate more useful insights.
Combining both Excel and Python can be fruitful and makes Data Analysis more interesting. ExcelWriter is used for performing different Excel operations using Python. It provides a wide variety of functionalities like creating an Excel, writing data into an Excel sheet, creating visualizations in Excel, etc.
Tags: dataviz, Excel, Python, visualizações
IFORS Developing Countries OR Resources Website
Posted by Armando Brito Mendes | Filed under Investigação Operacional, materiais ensino, SAD - DSS

Clique na imagem para seguir o link
Artigos e software relacionado com Investigação Operacional
Click below on required topic headings to access papers or click here to access International Abstracts in OR
- Agriculture
- Communication
- Community OR
- Current Events
- Education
- Energy
- Environment
- Health
- Industry
- Infrastructure
- Labor
- Law Enforcement
- Safety
- General Articles
- Finance
- Transportation
- Free OR Software
Tags: software de otimização
Data Analysis Method: Mathematics Optimization to Build Decision Making
Posted by Armando Brito Mendes | Filed under Investigação Operacional, matemática, SAD - DSS

clique na imagem para seguir o link
Uma pequena introdução à utilização de otimização na análise de dados
Optimization is a problem associated with the best decision that is effective and efficient decisions whether it is worth maximum or minimum by way of determining a satisfactory solution.
Optimization is not a new science. It has grown even since Newton in the 17th century discovered how to count roots. Currently the science of optimization is still evolving in terms of techniques and applications. Many cases or problems in everyday life that involve optimization to solve them. Lately much developed especially in the emergence of new techniques to solve the problem of optimization. To mention some, among others, conic programming, semi definite programming, semi infinite programming and some meta heuristic techniques.
Tags: análise de dados, data mining, otimização
Top Excel Tips For Data Analysts
Posted by Armando Brito Mendes | Filed under Bases de Dados, SAD - DSS
clicar na imagem apra seguir o link
Excelentes concelhos para utilização das últimas ferramentas implementadas no Excel.
Tags: Excel, programação em folha de cálculo
Deconstructing Recommender Systems
Posted by Armando Brito Mendes | Filed under SAD - DSS
clique na imagem para seguir o link
uma boa descrição dos sistemas de recomendação usados em sites web
Deconstructing Recommender Systems
How Amazon and Netflix predict your preferences and prod you to purchase

One morning in April, we each directed our browsers to Amazon.com’s website. Not only did the site greet us by name, the home page opened with a host of suggested purchases. It directed Joe to Barry Greenstein’s Ace on the River: An Advanced Poker Guide, Jonah Lehrer’s Imagine: How Creativity Works, and Michael Lewis’s Boomerang: Travels in the New Third World. For John it selected Dave Barry’s Only Travel Guide You’ll Ever Need, the spy novel Mission to Paris, by Alan Furst, and the banking exposé The Big Short: Inside the Doomsday Machine, also by Michael Lewis.
Guardar
Tags: sistemas de informação
Data Visualization with JavaScript
Posted by Armando Brito Mendes | Filed under estatística, SAD - DSS, software, visualização
clique na figura para seguir o link
Um bom e-book sobre como construir visualizações com JavaScript
It’s getting hard to ignore the importance of data in our lives. Data is critical to the largest social organizations in human history. It can affect even the least consequential of our everyday decisions. And its collection has widespread geopolitical implications. Yet it also seems to be getting easier to ignore the data itself. One estimate suggests that 99.5% of the data our systems collect goes to waste. No one ever analyzes it effectively.
Data visualization is a tool that addresses this gap.
Effective visualizations clarify; they transform collections of abstract artifacts (otherwise known as numbers) into shapes and forms that viewers quickly grasp and understand. The best visualizations, in fact, impart this understanding subconsciously. Viewers comprehend the data immediately—without thinking. Such presentations free the viewer to more fully consider the implications of the data: the stories it tells, the insights it reveals, or even the warnings it offers. That, of course, defines the best kind of communication.
If you’re developing web sites or web applications today, there’s a good chance you have data to communicate, and that data may be begging for a good visualization. But how do you know what kind of visualization is appropriate? And, even more importantly, how do you actually create one? Answers to those very questions are the core of this book. In the chapters that follow, we explore dozens of different visualizations and visualization techniques and tool kits. Each example discusses the appropriateness of the visualization (and suggests possible alternatives) and provides step-by-step instructions for including the visualization in your own web pages.
To give you a better idea of what to expect from the book, here’s a quick description of what the book is, and what it is not.
Tags: belo, data mining, desnvolvimento de software
ontologies and data models
Posted by Armando Brito Mendes | Filed under materiais para profissionais, SAD - DSS
Já se perguntaram qual a diferença entre ontologias e modelos de dados?
Ontologies versus Data Models
Data models have been with us since Ted Codd described normalization in 1970 and Peter Chen published his paper on entity relationship diagrams in 1976. Ontology as a discipline in philosophy can trace its roots to ancient Greece. As applied to data management, it is much more recent than data modeling and has only appeared in the past few years. But just what is the difference between ontologies and data models? If they are both about data, do they not boil down to the same thing?
Tags: captura de conhecimento, data mining
IFORS Education Resources Project
Posted by Armando Brito Mendes | Filed under estatística, Investigação Operacional, SAD - DSS, software
portal com materal sobre Investigação Operacional, otimização e SADs
Welcome to the International Federation of Operational Research Societies (IFORS) Education Resources Project
- Main Page (19:13, 3 December 2013)
- Biased Random-Key Genetic Algorithms: A Tutorial (21:57, 2 December 2013)
- The Discrete Event System Specification Formalism (19:59, 2 December 2013)
- Urban Operations Research (01:36, 2 December 2013)
- Stochastic Models for Design and Planning (01:34, 2 December 2013)
- Queueing Theory Books Online (01:31, 2 December 2013)
- Practical Queueing Theory in Java (01:31, 2 December 2013)
- Explore Queueing Theory for Scheduling, Resource Allocation and Traffic Flow Applications (01:28, 2 December 2013)
- Stochastic Processes Course Notes (01:26, 2 December 2013)
- Test Problems for Non-Linear Programming (01:23, 2 December 2013)
- OR Notes: Separable Programming (01:21, 2 December 2013)
- OR Notes: Non-Linear Programming (01:20, 2 December 2013)
Tags: decisao em grupo, decisão médica, otimização, previsão, problemas, programação em folha de cálculo, software de otimização, software estatístico
Analytic Hierarchy Process (AHP)
Posted by Armando Brito Mendes | Filed under ADM - multicritério, Investigação Operacional, planeamento, SAD - DSS

Uma página no facebook sobre esta técnica de multicritério
• To disseminate knowledge and resources on Analytic Hierarchy Process (AHP) based Multi Criteria Decision Making (MCDM) technique • To create a forum for AHP users • To disseminate AHP related activities taking place globally • Helping people and institutions in making complex decisions •
Tags: decisao em grupo, decisão médica
Data Warehousing Review
Posted by Armando Brito Mendes | Filed under materiais para profissionais, SAD - DSS

Bom site com muitos conselhos úteis sobre DW e BI
Data Warehouses are increasingly used by enterprises to increase efficiency and competitiveness. Using Scorecarding, Data Mining and OLAP analysis, business value can be extracted from Data Warehouses.
Data Cleansing for Data Warehousing: How important is Extract, Transform, Load (ETL) to data Warehousing?
Introduction to OLAP : Slice, Dice and Drill!
Selecting an OLAP Application: Minimizing risks in the product selection process
Planning for a Data Warehouse: Starting a Data Warehousing Project? Three words – Plan, Plan and Plan!
Designing OLAP Solutions: MOLAP, ROLAP, HOLAP and other acronyms!
Introduction to Metadata: Case study of an implementation in the insurance industry
Tags: data mining, DW \ BI