The Dangers of Bling Data Visualizations
Posted by Armando Brito Mendes | Filed under estatística, visualização
Excelente de descrição de erros em visualização
The Dangers of Bling Data Visualizations
Given the volume of information that’s pouring into the enterprise from so many disparate sources, knowledge workers need to be able to visualize information in order to analyze it and extrapolate insights effectively.
When business users can visualize information, they’re able to process it more effectively and make faster and better decisions, according to Aberdeen research. Business users are constantly seeking the best ways to understand the data behind the data. If a monthly sales figure is low, what are the reasons the sales team is underperforming? The most effective way to help business users understand the data behind the data is by making it visual for them.
Data visualization has recently made its way into the mainstream by the way of infographics, business intelligence dashboards and, in some cases, statistical graphics. However, today data visualization comes in many forms and more often than not there might be too much “bling” incorporated into these data representations, leaving an audience with nothing more than a pretty picture. In this article, we contrast some good and bad examples of visualizations via examination of the salient features of the graphical displays. We will also demonstrate how poorly designed visualizations can lead to erroneous decisions.
Tags: big data, data mining, Estat Descritiva
In flight: see the planes in the sky right now
Posted by Armando Brito Mendes | Filed under visualização
Espantosa visualização de todos os aviões no ar, neste momento
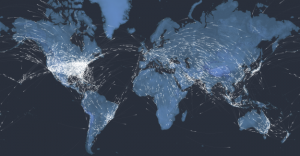
To mark 100 years of passenger air travel, our stunning interactive uses live data to show every one of the thousands of commercial planes currently in the air, charts the history of aviation since 1914, and asks what comes next for the industry.
Kiln and the Guardian explored the 100-year history of passenger air travel, and to kick off the interactive is an interactive map that uses live flight data from FlightStats. The map shows all current flights in the air right now. Nice.
Be sure to click through all the tabs. They’re worth the watch and listen, with a combination of narration, interactive charts, and old photos.
And of course, if you like this, you’ll also enjoy Aaron Koblin’s classic Flight Patterns.
Tags: belo, big data, data mining
Music Timeline
Posted by Armando Brito Mendes | Filed under visualização
Mais uma excelente visualização interativa de dados dos labs da google
Two Google research groups, Big Picture and Music Intelligence, got together and made a music timeline baby.
The Music Timeline shows genres of music waxing and waning, based on how many Google Play Music users have an artist or album in their music library, and other data (such as album release dates). Each stripe on the graph represents a genre; the thickness of the stripe tells you roughly the popularity of music released in a given year in that genre. (For example, the “jazz” stripe is thick in the 1950s since many users’ libraries contain jazz albums released in the ’50s.) Click on the stripes to zoom into more specialized genres.
As you’d expect, the initial view is a stacked area chart that represents the popularity of genres over time, which feels fairly familiar, but then you interact with the stacks and it gets more interesting and almost surprisingly fast. The best part is the pointers to specific albums as you mouse over.
Tags: belo, big data, data mining, DW \ BI
Apache Spark
Posted by Armando Brito Mendes | Filed under materiais para profissionais, software

Uma alternativa ao Hadoop para computação com dados em memória
What is Apache Spark?
Apache Spark is an open source cluster computing system that aims to make data analytics fast — both fast to run and fast to write.
To run programs faster, Spark offers a general execution model that can optimize arbitrary operator graphs, and supports in-memory computing, which lets it query data faster than disk-based engines like Hadoop.
To make programming faster, Spark provides clean, concise APIs in Scala, Java and Python. You can also use Spark interactively from the Scala and Python shells to rapidly query big datasets.
What can it do?
Spark was initially developed for two applications where placing data in memory helps: iterative algorithms, which are common in machine learning, and interactive data mining. In both cases, Spark can run up to 100x faster than Hadoop MapReduce. However, you can use Spark for general data processing too. Check out our example jobs.
Spark is also the engine behind Shark, a fully Apache Hive-compatible data warehousing system that can run 100x faster than Hive.
While Spark is a new engine, it can access any data source supported by Hadoop, making it easy to run over existing data.
Tags: análise de dados, big data, data mining, DW \ BI
What is Apache Mahout?
Posted by Armando Brito Mendes | Filed under software

Um exemplo dos muitos projetos open source for big data
The Apache Mahout™ machine learning library’s goal is to build scalable machine learning libraries.
Mahout currently has
- User and Item based recommenders
- Matrix factorization based recommenders
- K-Means, Fuzzy K-Means clustering
- Latent Dirichlet Allocation
- Singular value decomposition
- Logistic regression based classifier
- Complementary Naive Bayes classifier
- Random forest decision tree based classifier
- High performance java collections (previously colt collections)
- A vibrant community
With scalable we mean:
Scalable to reasonably large data sets. Our core algorithms for clustering, classfication and collaborative filtering are implemented on top of Apache Hadoop using the map/reduce paradigm. However we do not restrict contributions to Hadoop based implementations: Contributions that run on a single node or on a non-Hadoop cluster are welcome as well. The core libraries are highly optimized to allow for good performance also for non-distributed algorithms
Scalable to support your business case. Mahout is distributed under a commercially friendly Apache Software license.
Tags: big data, data mining, DW \ BI
The Age of Data
Posted by Armando Brito Mendes | Filed under estatística, videos
A era dos dados
Whiteboards
The Age of Data
Actian Big Data Analytics Platform
Actian DataCloud Platform
Big Data Analytics
Creating Value from Big Data and Hadoop
A New World for Analytics
The Need for an Analytic Platform
Seamless Integration
Analytic Offload
Creating Business Value with Analytics
Tags: big data, data mining, DW \ BI, Estat Descritiva
Big Data or Pig Data?
Posted by Armando Brito Mendes | Filed under materiais para profissionais

Um conto sobre a necessidade de conhecimento de domínio (teoria)
(A fable on huge amounts of data and why we don’t need models)
There was a pig who wanted to be a scientist. He was not interested in models. When asked how he planned on making sense of the world, the pig would say in a deep mysterious voice, “I don’t do models: the world is my model” and then with a twinkle in his eyes, look at his interlocutor smugly.
By his phrase, “I don’t do models, the world is my model”, he meant that the world’s data was enough for him, the pig scientist. The more the data, the more accurately the pig declared, he would be able to predict what might happen in the world.
Tags: big data, data mining, DW \ BI
The Field Guide to Data Science
Posted by Armando Brito Mendes | Filed under materiais para profissionais
Bom e-book sobre data science
Data Science is the competitive advantage of the future for organizations interested in turning their data into a product through analytics. Industries from health, to national security, to finance, to energy can be improved by creating better data analytics through Data Science. The winners and the losers in the emerging data economy are going to be determined by their Data Science teams.
Booz Allen Hamilton created The Field Guide to Data Science to help organizations of all types and missions understand how to make use of data as a resource. The text spells out what Data Science is and why it matters to organizations as well as how to create Data Science teams. Along the way, our team of experts provides field-tested approaches, personal tips and tricks, and real-life case studies. Senior leaders will walk away with a deeper understanding of the concepts at the heart of Data Science. Practitioners will add to their toolboxes.
Tags: big data, captura de conhecimento, data mining, DW \ BI
noticias, textos e tudo o mais sobre big data
Posted by Armando Brito Mendes | Filed under materiais para profissionais

muito material interessante sobre big data
Tags: big data, data mining, DW \ BI
Machine Learning MOOC
Posted by Armando Brito Mendes | Filed under estatística, materiais ensino, videos
Um curso muito completo de machine learning
About the Course
Machine learning is the science of getting computers to act without being explicitly programmed. In the past decade, machine learning has given us self-driving cars, practical speech recognition, effective web search, and a vastly improved understanding of the human genome. Machine learning is so pervasive today that you probably use it dozens of times a day without knowing it. Many researchers also think it is the best way to make progress towards human-level AI. In this class, you will learn about the most effective machine learning techniques, and gain practice implementing them and getting them to work for yourself. More importantly, you’ll learn about not only the theoretical underpinnings of learning, but also gain the practical know-how needed to quickly and powerfully apply these techniques to new problems. Finally, you’ll learn about some of Silicon Valley’s best practices in innovation as it pertains to machine learning and AI.
This course provides a broad introduction to machine learning, datamining, and statistical pattern recognition. Topics include: (i) Supervised learning (parametric/non-parametric algorithms, support vector machines, kernels, neural networks). (ii) Unsupervised learning (clustering, dimensionality reduction, recommender systems, deep learning). (iii) Best practices in machine learning (bias/variance theory; innovation process in machine learning and AI). The course will also draw from numerous case studies and applications, so that you’ll also learn how to apply learning algorithms to building smart robots (perception, control), text understanding (web search, anti-spam), computer vision, medical informatics, audio, database mining, and other areas.
FAQ
- What is the format of the class?The class will consist of lecture videos, which are broken into small chunks, usually between eight and twelve minutes each. Some of these may contain integrated quiz questions. There will also be standalone quizzes that are not part of video lectures, and programming assignments.
- How much programming background is needed for the course?The course includes programming assignments and some programming background will be helpful.
- Do I need to buy a textbook for the course?No, it is self-contained.
- Will I get a statement of accomplishment after completing this class?Yes. Students who successfully complete the class will receive a statement of accomplishment signed by the instructor.
Tags: big data, bioinformatica, captura de conhecimento, data mining, DW \ BI