Intermediate Statistics
Posted by Armando Brito Mendes | Filed under estatística, materiais ensino, software, videos

Muito boas aulas e slides sobre ANOVA, ANCOVA e regressão
Welcome to the wood of suicides (is anyone getting all these Dante references or am I just wasting my time here?), where self flagellation is the name of the game. You will experience the bowel-evacuating effect of multiple regression, the bone-splintering power of ANOVA and the nose-hair pulling torment of factor analysis. Can you cope: I think not, mortal filth. Be warned, your brain will be placed in a jar of cerebral fluid and I will toy with it at my leisure.
Tags: decisão médica, IBM SPSS Statistics, inferência, software estatístico
Analysis of Variance
Posted by Armando Brito Mendes | Filed under estatística, materiais ensino, software, videos

Vários materiais, incluindo vídeos, sobre ANOVA e Regressão
SPSS Topics
Analysis of Variance
These pages contain links from all parts of our web site and others web sites on analysis of variance. The topics will vary from introductory to advanced.
SPSS Data Analysis Examples
SPSS Seminars
SPSS Web Books
SPSS Frequently Asked Questions
Textbook Examples
SPSS Library
SPSS Code Fragments
Tags: análise de dados, IBM SPSS Statistics, inferência, inquéritos, software estatístico
SPSS On-Line Training Workshop
Posted by Armando Brito Mendes | Filed under estatística, software, videos

Muitos e bons videos de utilização das versões mais recentes do SPSS
Tutorials and Clips
![]() Overview of SPSS
Overview of SPSS
![]() Getting Started
Getting Started
![]() Options in the Edit Menu
Options in the Edit Menu
![]() Open Files in SPSS
Open Files in SPSS
![]() Define/Modify Variables
Define/Modify Variables
![]() File Manipulation: sort, merge, Transpose
File Manipulation: sort, merge, Transpose
![]() File Manipulation: select, split
File Manipulation: select, split
![]() Programmability Extension-Using R inside SPSS , …
Programmability Extension-Using R inside SPSS , …
Tags: IBM SPSS Statistics, software estatístico
OrgOrgChart: The Evolution of an Organization
Posted by Armando Brito Mendes | Filed under planeamento, videos, visualização

As empresas são organismos vivos: animação do organigrama de uma grande empresa
The OrgOrgChart (Organic Organization Chart) project looks at the evolution of a company’s structure over time. A snapshot of the Autodesk organizational hierarchy was taken each day between May 2007 and June 2011, a span of 1498 days.
Each day the entire hierarchy of the company is constructed as a tree with each employee represented by a circle, and a line connecting each employee with his or her manager. Larger circles represent managers with more employees working under them. The tree is then laid out using a force-directed layout algorithm.
Each second in the animation is about one week of activity, and acquisitions are most obvious when big clumps of people join the company. The long-term changes are a little harder to see, because the branches in the network fade into the background. Recomputing the layout each week might be good for the next round.
Tags: modelos empresariais
Introduction to Diagrams
Posted by Armando Brito Mendes | Filed under ARS - SNA, Investigação Operacional, videos, visualização

Uma bela introdução aos grafos
Diagrams are everywhere — from the established conventions of highway signs to the newly emerging visualizations appearing on social networking websites. Most people have a personal experience of diagrams whether drawing directions or figuring out how to operate a new computer. Yet very few people are familiar with how we read or construct diagrams.
This short film introduces the language of diagrams and their role in visual thinking and communication. As only a film can do, it reveals the vocabulary “in the wild” and in the context of making and using diagrams.
Tags: ARS\SNA intro, definição
Videoaulas sobre funções do Project 2010
Posted by Armando Brito Mendes | Filed under materiais ensino, software, videos
Um excelente blogue com muitos filmes curtos sobre o Project 2010
Para quem busca mais uma fonte de aprendizado relacionado a MS Project 2010:
1-) Project 2010 – Criação de Tarefa Simples – http://www.youtube.com/watch?v=uGnZ4Uook4Q
2-) Project 2010 – Duração das Tarefas – http://www.youtube.com/watch?v=jwt8M9ol-PI
3-) Project 2010 – Agrupando Tarefas – http://www.youtube.com/watch?v=1cuEeicJ4_4
4-) Project 2010 – Agendamento Automático de Datas – http://www.youtube.com/watch?v=9XNQ6vmo3zk
5-) Project 2010 – Informações Gerais do Projeto – http://www.youtube.com/watch?v=OigwPjqYgNM
6-) Project 2010 – Vinculos entre Tarefas (Termino Inicio) – http://www.youtube.com/watch?v=5TgBiJCE4lY
7-) Project 2010 – Vinculo entre Tarefas (Inico Inicio) – http://www.youtube.com/watch?v=JtJj9QvExeU
😎 Project 2010 – Latência entre Tarefas Intervalo Fixo de Dias – http://www.youtube.com/watch?v=6N0myGJ0nZs
9-) Project 2010 – Latência entre Tarefas Percentual Duração Tarefa – http://www.youtube.com/watch?v=RL8XrN1vpKE
10-) Project 2010 – Vínculos entre Tarefas ( Término – Término) – http://www.youtube.com/watch?v=ZFWSdYTCckY
Tags: gestão de projetos
Modelos de dados
Posted by Armando Brito Mendes | Filed under estatística, Investigação Operacional, matemática, materiais ensino, videos
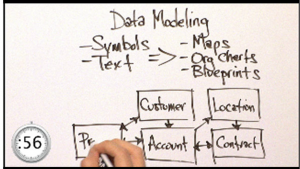
Tackling tough tech in a minute or less. This episode explores Data Modeling with Steve Hoberman, Data Modeling expert, author and educator.
Tags: análise de dados, data mining, otimização
RSA videos – Manuel Lima
Posted by Armando Brito Mendes | Filed under ARS - SNA, videos

Bom vídeo de divulgação sobre análise de redes sociais (SNA)
Tags: ARS\SNA intro
RSA Animate – The Power of Networks
Posted by Armando Brito Mendes | Filed under ARS - SNA, materiais para profissionais, videos
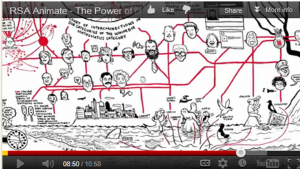
Excelente video de divulgação sobre análise de redes sociais
Tags: ARS\SNA intro
uso do @RISK em Português
Posted by Armando Brito Mendes | Filed under estatística, Investigação Operacional, videos
Vídeos em português para utilização do @RISK
Estes tutoriais em vídeo percorrerão uma análise do @RISK com você. Fora a Visão Geral, eles possuem menos de um minuto cada e vão ajudá-lo a começar a usar rapidamente o @RISK. Para começar agora mesmo, veja a “Visão Geral em 2 Minutos”.
» Visualizar todos os vídeos de Inicialização do Uso em fluxo contínuo
- Início Rápido
- MODELAR — Configure seu modelo
- SIMULAR — Rode a Simulação
- COMPREENDA — Analise os Resultados da Simulação
- Histogramas e Curvas Cumulativas
- Gráficos de Tornado
- Gráficos de Dispersão
- Dispersão a partir do Tornado
- Sobrepondo Gráficos de Resultados
- Marcadores de Gráficos
- Títulos de Gráficos
- Customizar Gráficos
- Gráficos de Resumo: Box Plots de Resumo e Tendência
- Janela Resumo de Resultados
- Janela de Dados
- Análise de Sensibilidade
- Relatórios no Excel
- Funcionalidades Avançadas
Tags: @RISK, Excel, software estatístico