OrgOrgChart: The Evolution of an Organization
Posted by Armando Brito Mendes | Filed under planeamento, videos, visualização
As empresas são organismos vivos: animação do organigrama de uma grande empresa
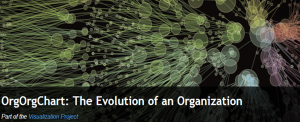
The OrgOrgChart (Organic Organization Chart) project looks at the evolution of a company’s structure over time. A snapshot of the Autodesk organizational hierarchy was taken each day between May 2007 and June 2011, a span of 1498 days.
Each day the entire hierarchy of the company is constructed as a tree with each employee represented by a circle, and a line connecting each employee with his or her manager. Larger circles represent managers with more employees working under them. The tree is then laid out using a force-directed layout algorithm.
Each second in the animation is about one week of activity, and acquisitions are most obvious when big clumps of people join the company. The long-term changes are a little harder to see, because the branches in the network fade into the background. Recomputing the layout each week might be good for the next round.
Tags: modelos empresariais
Comments are closed.