Vector maps on the web with Mapbox GL
Posted by Armando Brito Mendes | Filed under mapas SIG's, materiais para profissionais, software, visualização
Novas funcionalidades da biblioteca Java Script para desenhar mapas vetoriais
Online mapping just got an upgrade:
Announcing Mapbox GL JS — a fast and powerful new system for web maps. Mapbox GL JS is a client-side renderer, so it uses JavaScript and WebGL to dynamically draw data with the speed and smoothness of a video game. Instead of fixing styles and zoom levels at the server level, Mapbox GL puts power in JavaScript, allowing for dynamic styling and freeform interactivity.
For the non-developers: Online maps are typically stored pre-made on a server, in the form of a bunch of image files that are stitched together when you zoom in and out of a map. So developers have to periodically update the image files if they want their base maps to change. It’s a hassle, which is why base maps often look similar. With Mapbox GL, making changes is easier because the development pipeline is shorter.
More details on the JavaScript library here.
Tags: desnvolvimento de software, mapas
BEAKER The data scientist’s laboratory
Posted by Armando Brito Mendes | Filed under materiais para profissionais, software
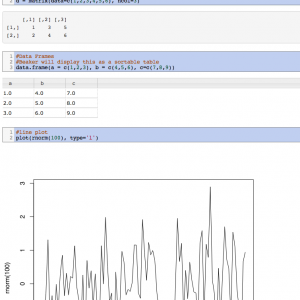
Um ambiente de programação q aceita várias linguagens
Beaker is a code notebook that allows you to analyze, visualize, and document data using multiple programming languages including Python, R, Groovy, Julia, and Node. Beaker’s plugin-based polyglot architecture enables you to seamlessly switch between languages and add support for new languages.
Tags: data mining, desnvolvimento de software, R-software
Resources for Getting Started with R
Posted by Armando Brito Mendes | Filed under estatística, software
Recursos para começar a usar o R
Resources for Getting Started with R
R, the open source statistical software environment, is powerful but can be a challenge to approach for beginners. For me, the best way to learn R, especially on the visualization side of things, is to dive right in. Grab some data and make some charts, or better yet, find a graph you like and try to replicate it.
R core functionality and the many available packages let you do a lot without having to know what’s going on underneath. I use this approach in Visualize This and the tutorials around here. I like the satisfaction of immediate results. Then I learn the nitty gritty later.
That said, it doesn’t hurt to familiarize yourself with the environment. Also, visualization is a small part of what you can do with R, so it can help to know what else you can do analysis-wise.
Tags: data mining, R-software, software estatístico
An intro to R for new programmers
Posted by Armando Brito Mendes | Filed under estatística, software
Introdução às estruturas de dados no R
Following the lead of JavaScript for Cats by Maxwell Ogden, Scott Chamberlain and Carson Sievert wrote R for Cats. It’s a playful introduction to R intended for those who have little to no programming experience.
The bulk of it so far is a primer on data structures, and there’s a little bit on functions and some dos and don’ts. It’s stuff you should know before you get into more advanced tutorials.
Mainly though: ooo look, kitty.
Once you’re done with that (It only takes about 30 minutes.), there are lots of other resources for getting started with R.
Tags: data mining, R-software, software estatístico
Create a barebones R package from scratch
Posted by Armando Brito Mendes | Filed under estatística, software
Criar pacotes para o R é muito fácil
While we’re on an R kick, Hilary Parker described how to create an R package from scratch, not just to share code with others but to save yourself some time on future projects. It’s not as hard as it seems.
This tutorial is not about making a beautiful, perfect R package. This tutorial is about creating a bare-minimum R package so that you don’t have to keep thinking to yourself, “I really should just make an R package with these functions so I don’t have to keep copy/pasting them like a goddamn luddite.” Seriously, it doesn’t have to be about sharing your code (although that is an added benefit!). It is about saving yourself time. (n.b. this is my attitude about all reproducibility.)
I need to do this. I’ve been meaning to wrap everything up for a while now, but it seemed like such a chore. Sometimes I’d even go back to my own tutorials for some copy and paste action. Now I know better. And that’s half the battle.
Tags: data mining, R-software, software estatístico
Using R in Nonparametric Statistical Analysis
Posted by Armando Brito Mendes | Filed under estatística, materiais ensino, software

Blog com vários tutoriais para usar estatísticas não paramétricas simples em R
- Using R in Nonparametric Statistical Analysis: The Kruskall-Wallace Test for One-Way Analysis of Variance
- Using R in Nonparametic Statistical Analysis: The Binomial Sign Test
Tags: desnvolvimento de software, R-software, software estatístico
High-detail maps with Disser
Posted by Armando Brito Mendes | Filed under mapas SIG's, software, visualização
Software open source para trabalhar com mapas
Open data consultancy Conveyal released Disser, a command-line tool to disaggregate geographic data to show more details. For example, we’ve seen data represented with uniformly distributed dots to represent populations, which is fine for a zoomed out view. However, when you get in close, it can be useful to see distributions more accurately represented.
If the goal of disaggregation is to make a reasonable guess at the data in its pre-aggregated form, we’ve done an okay job. There’s an obvious flaw with this map, though. People aren’t evenly distributed over a block — they’re concentrated into residential buildings.
So Disser combines datasets of different granularity, so that you can see spreads and concentrations that are closer to real life.
Tags: belo, image mining, mapas
Why use R? Five reasons
Posted by Armando Brito Mendes | Filed under materiais para profissionais, software
Bom blogue, as principais razões para usar R
Why use R? Five reasons.
In this post I will go through 5 reasons: zero cost, crazy popularity, awesome power, dazzling flexibility, and mind-blowing support. I believe R is the best statistical programming language to learn. As a blogger who has contributed over 150 posts in Stata and over 100 in R I have extensive experience with both a proprietary statistical programming language as well as the open source alternative. In my graduate career I have also had the opportunity to experiment with the proprietary software SPSS, SAS, Mathematica, as well as MPlus.
Tags: big data, definição, R-software, software estatístico
SPSS Internet Resources
Posted by Armando Brito Mendes | Filed under estatística, software

Links para variados sites sobre SPSS
The SPSS Inc website
SPSS are now owned by IBM. The following links lead to the appropriate IBM pages now.
http://www-01.ibm.com/software/analytics/spss/ The home page of the SPSS Inc. website
http://www-01.ibm.com/software/uk/analytics/spss/ SPSS Inc. UK page
(If at some future time SPSS Inc change the structure of their website, you may find that only the first of the above links still works.)
The ASSESS-NEWS list
http://www.jiscmail.ac.uk/lists/assess-news.html Information about it, and an archive of past messages.
Other useful links
news:comp.soft-sys.stat.spss The SPSS newsgroup (this carries fairly heavy traffic).
Tags: IBM SPSS Statistics, software estatístico
SPSS Macros on the Internet
Posted by Armando Brito Mendes | Filed under estatística, materiais para profissionais, software
Alguns sites com macros para SPSS
What sources of SPSS macros are available on the Internet?
Here are a few that I know about; I hope other people will tell us about ones that should be listed but aren’t.
An obvious starting point is SPSS Inc’s own Macro Library at http://www.spss.com/tech/stat/macros/ (it doesn’t contain very many, though, and they are statistical rather than utilities). If you are planning to adapt or write macros, it’s also worth seeing what’s in SPSS Inc’s AnswerNet Solutions. Go to http://www.spss.com/tech/answer/, specify Product; SPSS Base and Free Text: macro, then click on the page’s Search button.Raynald Levesque’s site http://pages.infinit.net/rlevesqu/ includes many pages on macros (including examples and some tutorial materials). But you should also look at the examples in his pages on syntax, as some of these are based on macros.
Newsgroups are also a useful source of macros. Searches of their archives can be very rewarding if you can get your search terms right (see our Other Internet Resources page).
Confidence intervals for proportions, differences between proportions and related quantities. See Dr Robert G. Newcombe’s home page at http://www.uwcm.ac.uk/uwcm/ms/Robert.html. Note that these are SPSS programs rather than macros, despite being described as macros by the author.
Polytomous logistic regression (of particular interest to users of SPSS 8.0 and earlier). For macros by John Hendrickx and Prof. Dr. Steffen Kühnel see http://www.sls.wau.nl/bk/bedrijfskunde/jhendrickx/spss/mlogist/
Regression: evaluating collinearity in models with interactions or non-linear terms. For a macro by Ben Pelzer, Manfred te Grotenhuis, Jan Lammers, John Hendrickx, see http://www.sls.wau.nl/bk/bedrijfskunde/jhendrickx/spss/perturb/perturb.html
Tags: Estat Descritiva, IBM SPSS Statistics, inferência, software estatístico