BEAKER The data scientist’s laboratory
Posted by Armando Brito Mendes | Filed under materiais para profissionais, software
Um ambiente de programação q aceita várias linguagens
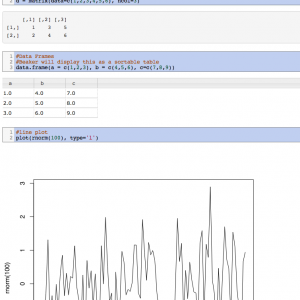
Beaker is a code notebook that allows you to analyze, visualize, and document data using multiple programming languages including Python, R, Groovy, Julia, and Node. Beaker’s plugin-based polyglot architecture enables you to seamlessly switch between languages and add support for new languages.
Tags: data mining, desnvolvimento de software, R-software
Resources for Getting Started with R
Posted by Armando Brito Mendes | Filed under estatística, software
Recursos para começar a usar o R
Resources for Getting Started with R
R, the open source statistical software environment, is powerful but can be a challenge to approach for beginners. For me, the best way to learn R, especially on the visualization side of things, is to dive right in. Grab some data and make some charts, or better yet, find a graph you like and try to replicate it.
R core functionality and the many available packages let you do a lot without having to know what’s going on underneath. I use this approach in Visualize This and the tutorials around here. I like the satisfaction of immediate results. Then I learn the nitty gritty later.
That said, it doesn’t hurt to familiarize yourself with the environment. Also, visualization is a small part of what you can do with R, so it can help to know what else you can do analysis-wise.
Tags: data mining, R-software, software estatístico
An intro to R for new programmers
Posted by Armando Brito Mendes | Filed under estatística, software
Introdução às estruturas de dados no R
Following the lead of JavaScript for Cats by Maxwell Ogden, Scott Chamberlain and Carson Sievert wrote R for Cats. It’s a playful introduction to R intended for those who have little to no programming experience.
The bulk of it so far is a primer on data structures, and there’s a little bit on functions and some dos and don’ts. It’s stuff you should know before you get into more advanced tutorials.
Mainly though: ooo look, kitty.
Once you’re done with that (It only takes about 30 minutes.), there are lots of other resources for getting started with R.
Tags: data mining, R-software, software estatístico
Create a barebones R package from scratch
Posted by Armando Brito Mendes | Filed under estatística, software
Criar pacotes para o R é muito fácil
While we’re on an R kick, Hilary Parker described how to create an R package from scratch, not just to share code with others but to save yourself some time on future projects. It’s not as hard as it seems.
This tutorial is not about making a beautiful, perfect R package. This tutorial is about creating a bare-minimum R package so that you don’t have to keep thinking to yourself, “I really should just make an R package with these functions so I don’t have to keep copy/pasting them like a goddamn luddite.” Seriously, it doesn’t have to be about sharing your code (although that is an added benefit!). It is about saving yourself time. (n.b. this is my attitude about all reproducibility.)
I need to do this. I’ve been meaning to wrap everything up for a while now, but it seemed like such a chore. Sometimes I’d even go back to my own tutorials for some copy and paste action. Now I know better. And that’s half the battle.
Tags: data mining, R-software, software estatístico
Using R in Nonparametric Statistical Analysis
Posted by Armando Brito Mendes | Filed under estatística, materiais ensino, software

Blog com vários tutoriais para usar estatísticas não paramétricas simples em R
- Using R in Nonparametric Statistical Analysis: The Kruskall-Wallace Test for One-Way Analysis of Variance
- Using R in Nonparametic Statistical Analysis: The Binomial Sign Test
Tags: desnvolvimento de software, R-software, software estatístico
Why use R? Five reasons
Posted by Armando Brito Mendes | Filed under materiais para profissionais, software
Bom blogue, as principais razões para usar R
Why use R? Five reasons.
In this post I will go through 5 reasons: zero cost, crazy popularity, awesome power, dazzling flexibility, and mind-blowing support. I believe R is the best statistical programming language to learn. As a blogger who has contributed over 150 posts in Stata and over 100 in R I have extensive experience with both a proprietary statistical programming language as well as the open source alternative. In my graduate career I have also had the opportunity to experiment with the proprietary software SPSS, SAS, Mathematica, as well as MPlus.
Tags: big data, definição, R-software, software estatístico
Read Histograms and Use Them in R
Posted by Armando Brito Mendes | Filed under estatística, materiais para profissionais, visualização
Bom tutorial para construir histogramas no R
How to Read Histograms and Use Them in R
The histogram is one of my favorite chart types, and for analysis purposes, I probably use them the most. Devised by Karl Pearson (the father of mathematical statistics) in the late 1800s, it’s simple geometrically, robust, and allows you to see the distribution of a dataset.
If you don’t understand what’s driving the chart though, it can be confusing, which is probably why you don’t see it often in general publications.
Tags: análise de dados, data mining, Estat Descritiva, R-software, software estatístico
Data Intelligence and Analytics Resources
Posted by Armando Brito Mendes | Filed under materiais para profissionais, software, videos, visualização
Excelentes textos sobre ciencia dos dados e big data
3. Big Data
- Practical illustration of Map-Reduce (Hadoop-style), on real data
- A synthetic variance designed for Hadoop and big data
- Fast Combinatorial Feature Selection with New Definition of Predictive Power
4. Visualization
- Detecting Patterns with the Naked Eye
- 50+ Open Source Tools for Big Data
- 40 maps that explain the world
5. Best and Worst of Data Science
- 175 Analytic and Data Science Web Sites
- 6000 Companies Hiring Data Scientists
- 100 data science, analytics, big data, visualization books
6. New Analytics Start-up Ideas
- Uniquely identify a human being with two questions
- Selling data
- A new type of weapons-grade secure email
- R in your Browser
7. Rants about Healthcare, Education, etc.
- Why statistical community is disconnected from Big Data and how to fix it
- How to eliminate a trillion dollars in healthcare costs
- Job interview question: what is wrong with this picture?
8. Career Stuff, Training, Salary Surveys
- 17 short tutorials all data scientists should read (and practice)
- Why Companies can’t find analytic talent
- Six categories of data scientists …
9. Miscellaneous
- One Page R: A Survival Guide to Data Science with R
- Boosting Algorithms for Better Predictions
- Structuredness coefficient to find patterns and associations
10. DSC Webinar Series – with video access
- Predictive Analytics with Revolution Analytics and Hortonworks, The…
- BI For Big Data
- The Value of a Modern Data Architecture with Apache Hadoop and Tera…
- Accelerating Big Data
Tags: big data, captura de conhecimento, data mining, R-software
17 short tutorials all data scientists should read
Posted by Armando Brito Mendes | Filed under estatística, materiais para profissionais
Excelentes textos fundamentais para cientistas dos dados
Here’s the list:
- Practical illustration of Map-Reduce (Hadoop-style), on real data
- A synthetic variance designed for Hadoop and big data
- Fast Combinatorial Feature Selection with New Definition of Predict…
- A little known component that should be part of most data science a…
- 11 Features any database, SQL or NoSQL, should have
- Clustering idea for very large datasets
- Hidden decision trees revisited
- Correlation and R-Squared for Big Data
- Marrying computer science, statistics and domain expertize
- New pattern to predict stock prices, multiplies return by factor 5
- What Map Reduce can’t do
- Excel for Big Data
- Fast clustering algorithms for massive datasets
- Source code for our Big Data keyword correlation API
- The curse of big data
- How to detect a pattern? Problem and solution
- Interesting Data Science Application: Steganography
Related link: The Data Science Toolkit
Tags: análise de dados, big data, captura de conhecimento, data mining, Excel, R-software
Little Book of R for Time Series!
Posted by Armando Brito Mendes | Filed under estatística, software
Um excelente tutorial sobre modelos de previsão simples no R
- How to install R
- Using R for Time Series Analysis
Tags: previsão, R-software