visualização do intervalo de confiança
Posted by Armando Brito Mendes | Filed under estatística, materiais ensino, visualização
clicar na imagem para seguir o link
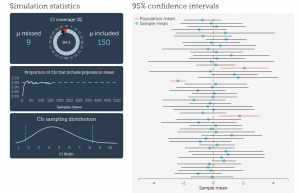
Boa forma de visualizar o conceito de Intervalo de Confiança Aleatório.
About the visualization
Some say that a shift from hypothesis testing to confidence intervals and estimation will lead to fewer statistical misinterpretations. Personally, I am not sure about that. But I agree with the sentiment that we should stop reducing statistical analysis to binary decision-making. The problem with CIs is that they are as unintuitive and as misunderstood p-values and null hypothesis significance testing. Moreover, CIs are often used to perform hypothesis tests and are therefore prone to the same misuses as p-values.
Tags: belo, definição, inferência
S-PLUS & R Class Links
Posted by Armando Brito Mendes | Filed under estatística, materiais ensino, materiais para profissionais, software
clicar na imagem para seguir o link
montes de materiais para R e S-PLUS.
S-PLUS & R Class Links
Instructor: Richard Herrington
Why Do We Care To Use the “S” Language? Does anyone care besides us? The Association for Computing Machinery (ACM) cares
S-Plus
- Introduction to S language (S-Plus, R)
- S-Plus Windows Notes (MASS – Brian Ripley)
- S-Plus 6 Users Guide
- S-Plus 6 Users Guide to “Introduction to the Practice of Statistics”
- Datasets for “Introduction to the Practice of Statistics”
- S-Plus Tutorial
- S-Plus Website
- S-Plus Official Documentation
S-PLUS Student Edition Download (Free)
- Student Edition 6.2 – This version of S-Plus has a 20,000 cell or 1,000 row limitation; is only for educational use; is good for only one year; and is a rather large download (100+ meg).
S-PLUS Free Experimental Libraries and User Contributed Libraries
- Research Libraries – Includes: S+CorrelatedData (mixed effects generalized linear models), S+Best (B-Spline methods), S+Resample (bootstrap library), S+Bayes (bayesian analysis), S+FDA (functional data analysis).
- User Contributed Libraries
Tinn-R Script Editor
- SourceForge Download Site – Download Tinn-R Setup Files; Tinn-R can serve as a script editor and “pager” for R Console. See Tinn-R Convenient Script Editor for R on Win32 Platform
R
Download Site for the Current Windows Install Binary and R Packages
- Main CRAN Website
- CRAN Windows Binary – Installer for Win32 (also available for MacOS X and Linux
- CRAN R Package Descriptions – Pdf manuals available for packages
- R Packages Organized by Topic – Organized by discipline and methodology
Web Interfaces to R Web Servers and Example R Scripts
- R Web Interfaces – Web/browser based interfaces to R script processing on a server
- Example R Scripts – Some of these scripts run on a server and results are communicated thru a web browser
- RSS Rweb Server – Link to http:/rss.acs.unt.edu R server
R, R(D)COM and Excel
- Introduction to R – ppt
- Using R with Excel – A (D)COM Server for the Windows Platform – Benchmarks article (needs updating badly – Rich)
- R(D)COM Server Homepage – Thomas Baier
- R(D)COM Listserve Archive
- Download for single install file – R-2.4.1, R(D)COM and RExcel only
- Download for single install file – R-2.4.1 – use this file for a comprehensive install of selectable components: R, Rcmdr, R(D)COM, RExcel, rcom, gobbi, Rgobbi, and Tinn-R. R Version 2.5.0 combined install found here.
- Installing The R(D)COM server – Help Pages
- Using The R(D)COM server – Help Pages
- Using R Within Excel – Help Pages
- Duncan Temple Lang’s R (D)COM Homepage
- Duncan Temple Lang’s R (D)COM Notes
- Duncan Temple Lang’s R (D)COM Client examples– directory listing
- Duncan Temple Lang’s R (D)COM Server – examples listing
- General Computing Considerations
Tags: Excel, R-software, software estatístico
Rice Virtual Lab in Statistics
Posted by Armando Brito Mendes | Filed under estatística, materiais ensino

clique na imagem para seguir o link
Referências úteis para conceitos de estatística básica.
 |
HyperStat Online An online statistics book with links to other statistics resources on the web. |
| Simulations/Demonstrations Java applets that demonstrate various statistical concepts. |
|
 |
Case Studies Examples of real data with analyses and interpretation |
| Analysis Lab Some basic statistical analysis tools. |
Tags: Estat Descritiva, inferência
Statistical Associates E-Book Catalog
Posted by Armando Brito Mendes | Filed under estatística, Investigação Operacional, matemática, materiais ensino
clicar na imagem para seguir o link
e-books grátis.
| TITLE | INFO | DESCRIPTION | EDITION | FREE | KINDLE |
| NO PASSWORD REQUIRED FOR TITLES IN THIS SECTION | |||||
| 2013 Annual Report, Statistical Associates Publishers | Info | Pages: 8. Coverage: General. | 2013 | Free | No Kindle edition |
 10 Worst Statistical Mistakes and Pitfalls 10 Worst Statistical Mistakes and Pitfalls |
Info | Coverage: For selected statistical procedures | 2015 | Free | No Kindle edition |
| Creating Simulated Datasets | Info | Pages: 15. Coverage: General, SPSS. | 2012 | Free | No Kindle edition |
| Game Theory | Info | Pages: 15. Coverage: General. | 2012 | Free | No Kindle edition |
| Probability | Info | Pages: 15. Coverage: General, SPSS, SAS, Stata. | 2013 | Free | No Kindle edition |
| Testing Statistical Assumptions | Info | Pages: 51. Coverage: General, SPSS. | 2012 | Free | Coming |
| E-MONOGRAPHS: ALL $5 AT AMAZON/KINDLE | |||||
| Association, Measures of | Info | Pages: 49. Coverage: General, SPSS. | 2012 | Free | Buy at Amazon |
| Correlation | Info | Pages: 60. Coverage: General, SPSS, SAS, Stata. | 2013 | Free | Buy at Amazon |
| Correspondence Analysis | Info | Pages: 37. Coverage: General, SPSS. | 2012 | Free | Buy at Amazon |
| Crosstabulation | Info | Pages: 60. Coverage: General, SPSS, SAS, Stata. | 2013 | Free | Buy at Amazon |
| Curve Fitting & Nonlinear Regression | Info | Pages: 53. Coverage: General, SPSS. | 2012 | Free | Buy at Amazon |
| Discriminant Function Analysis | Info | Pages: 52. Coverage: General, SPSS. | 2012 | Free | Buy at Amazon |
| Life Tables & Kaplan-Meier Analysis | Info | Pages: 32. Coverage: General, SPSS. | 2012 | Free | Buy at Amazon |
| Literature Review in Research and Dissertation Writing | Info | Pages: 52. Coverage: General. | 2013 | Free | Buy at Amazon |
| Multidimensional Scaling | Info | Pages: 55. Coverage: General, SPSS. | 2012 | Free | Buy at Amazon |
| Network Analysis | Info | Pages: 35. Coverage: General, UCINET. | 2012 | Free | Buy at Amazon |
| Ordinal Regression | Info | Pages: 93. Coverage: General, SPSS, SAS, Stata. | 2014 | Free | Buy at Amazon |
| Parametric Survival Analysis (Event History Analysis) | Info | Pages: 64. Coverage: General, Stata, SAS. | 2012 | Free | Buy at Amazon |
| Partial Correlation | Info | Pages: 40. Coverage: General, SPSS, SAS, Stata. | 2014 | Free | Buy at Amazon |
| Path Analysis | Info | Pages: 81. Coverage: General, SPSS AMOS. SAS, Stata. | 2014 | Free | Buy at Amazon |
| Power Analysis | Info | Pages: 36. Coverage: General, SPSS SamplePower, G*Power. | 2012 | Free | Buy at Amazon |
| Probit Regression & Response Models | Info | Pages: 92. Coverage: General, SPSS. | 2012 | Free | Buy at Amazon |
| Research Design | Info | Pages: 53. Coverage: General. | 2013 | Free | Buy at Amazon |
| Scales and Measures | Info | Pages: 91. Coverage: General, SPSS, SAS, Stata, WINSTEPS, jMetric | 2013 | Free | Buy at Amazon |
| Survey Research & Sampling | Info | Pages: 82. Coverage: General. | 2013 | Free | Buy at Amazon |
| Two-Stage Least Squares Regression | Info | Pages: 45. Coverage: General, Stata, SPSS, SAS. | 2013 | Free | Buy at Amazon |
| Variance Components Analysis | Info | Pages: 37. Coverage: General, SPSS, SAS. | 2012 | Free | Buy at Amazon |
| WLS: Weighted Least Squares Regression | Info | Pages: 54. Coverage: General, SPSS, SAS, Stata. | 2013 | Free | |
Tags: data mining, motores de busca
Electronic Statistics Textbook: StatSoft
Posted by Armando Brito Mendes | Filed under estatística, materiais ensino, refs bibliográficas
clique na imagem para seguir o link
Uma referência muito completa sobre métodos estatísticos e de data mining.
Proper citation:
- (Electronic Version): StatSoft, Inc. (2013). Electronic Statistics Textbook. Tulsa, OK: StatSoft. WEB: http://www.statsoft.com/textbook/.
- (Printed Version): Hill, T. & Lewicki, P. (2007). STATISTICS: Methods and Applications. StatSoft, Tulsa, OK.
Overview of Elementary Concepts in Statistics. In this introduction, we will briefly discuss those elementary statistical concepts that provide the necessary foundations for more specialized expertise in any area of statistical data analysis. The selected topics illustrate the basic assumptions of most statistical methods and/or have been demonstrated in research to be necessary components of one’s general understanding of the “quantitative nature” of reality (Nisbet, et al., 1987). Because of space limitations, we will focus mostly on the functional aspects of the concepts discussed and the presentation will be very short.
Further information on each of those concepts can be found in the Introductory Overview and Examples sections of this manual and in statistical textbooks. Recommended introductory textbooks are: Kachigan (1986), and Runyon and Haber (1976); for a more advanced discussion of elementary theory and assumptions of statistics, see the classic books by Hays (1988), and Kendall and Stuart (1979).
Tags: análise de dados, data mining, Estat Descritiva, qualidade
JStor – pesquisa de livros e artigos
Posted by Armando Brito Mendes | Filed under materiais ensino, refs bibliográficas

clicar na imagem para seguir o link
um site com muitos livros e revistas com temas variados.
- CONTACT US
- Terms & Conditions
- ©2000-2015 ITHAKA.
All Rights Reserved. JSTOR®, the JSTOR logo, JPASS® and ITHAKA® are registered trademarks of ITHAKA.

Tags: motores de busca
Montes de recursos sobre R
Posted by Armando Brito Mendes | Filed under estatística, materiais ensino, software

clique na imagem para abrir o link
Muitos recursos para o R que vão de exemplos introdutórios até ao multivariado.
|
Do it yourself Introduction to R R is a free statistical programming language environment. It is completely free to anyone — like the air you breath is free. For more information on why everyone should be using R, see here. |
|
|---|---|
|
The goal of this site is to allow someone to overcome the intimidation associated with learning the very basics of R and showing them the tools for continued usage. Let’s get started. Some assumptions: This site assumes you are using a Windows operating system and have a basic understanding of file structures and paths. You will also need to have administrator privileges in order to install R. Some of the notes linked on this page are standard HTML pages; most of the links on this page are in R script file format (they have the file extension.R). Beyond that; the site and any instructions or links on it should be self-explanatory. It is STRONGLY recommended that one progress through the modules in order. A brief explanation of this page is here. UPDATE NOTE: April 23, 2015: current R version is 3.2.0 These pages have been tested for use with Firefox, other browsers may display the pages incorrectly. |
Tags: análise de dados, data mining, Estat Descritiva, R-software, software estatístico
Base R Version
Posted by Armando Brito Mendes | Filed under estatística, materiais ensino, software, visualização
clicar na imagem para seguir o link
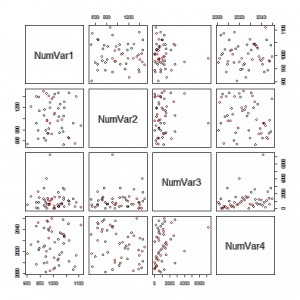
Excelentes exemplos de gráficos que podem usar nos trabalhos.
One Variable: Numeric Variable
One Variable: Factor Variable
Two Variables: Two Numeric Variables
Two Variables: Two Factor Variables
Two Variables: One Factor and One Numeric
Three Variables: Three Factor Variables
Three Variables: One Numeric and Two Factor Variables
Three Variables: Two Numeric and One Factor Variables
Three Variables: Three Numeric Variables
Scatterplot Matrix of all Numeric Vars, colored by a Factor variable
Tags: Estat Descritiva, R-software, software estatístico
SticiGui – online statistics book
Posted by Armando Brito Mendes | Filed under estatística, materiais ensino
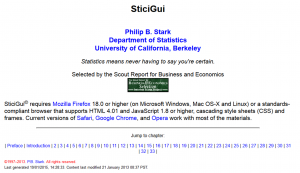
clique na imagem para seguir a ligação
- Chapter 0, Preface.
- Chapter 1, Introduction.
- Chapter 2, Reasoning and Fallacies.
-
- Rules of reasoning, arguments, validity and soundness, some valid rules of reasoning, formal fallacies, common formal fallacies, informal fallacies, fallacies of relevance and fallacies of evidence, fallacies of relevance, common fallacies of relevance, fallacies of evidence, common fallacies of evidence, summary, key terms.
- Chapter 3, Statistics.
- Chapter 4, Measures of Location and Spread.
- Chapter 5, Multivariate Data and Scatterplots.
- Chapter 6, Association.
- Chapter 7, Correlation and Association.
-
- The correlation coefficient, the effect of nonlinear association, homoscedasticity and heteroscedasticity and outliers on the correlation coefficient, summary, key terms.
- Chapter 8, Computing the Correlation Coefficient.
- Chapter 9, Regression.
- Chapter 10, Regression Diagnostics.
- Chapter 11, Errors in Regression.
- Chapter 12, Counting.
- Chapter 13, The Meaning of Probability: Theories of probability.
- Chapter 14, Set Theory: The Language of Probability.
- Chapter 15, Categorical Logic.
- Chapter 16, Propositional Logic.
- Chapter 17, Probability: Axioms and Fundaments.
- Chapter 18, The “Let’s Make a Deal” (Monty Hall) Problem.
- Chapter 19, Probability Meets Data.
- Chapter 20, Random Variables and Discrete Distributions.
-
- Random variables, sampling from 0-1 boxes, geometric distribution, the negative binomial distribution, sampling without replacement, the hypergeometric distribution, calculating binomial, geometric, hypergeometric, and negative binomial probabilities, discrete distributions, case study: trade secret litigation, summary, key terms.
- Chapter 21, The Long Run and the Expected Value.
-
- The Law of Large Numbers, implications of the law of large numbers, expected value of a random variable, expected value of the sample sum, expected value of binomial hypergeometric distributions, properties of the expected value, expected value of the sample mean and sample percentage, gambling and fair bets, expected values of some common distributions, summary, key terms.
- Chapter 22, Standard Error.
-
- Expected value of a transformation of a random variable, standard error of random variables, the standard error transformations of a random variable, independent random variables, standard errors of some common random variables, the SE of a single draw from a box of numbered tickets, SE of the sample sum of n random draws with replacement from a Box of Tickets, the SE of the sample mean of n random draws from a box of numbered tickets, the square-root law, the law of averages, the standard error of the binomial, geometric and negative binomial distributions, SE of the sample sum and mean of a simple random sample, the SE of the hypergeometric distribution, the finite population correction, summary, key terms.
- Chapter 23, The Normal Curve, the Central Limit Theorem, and Markov’s and Chebychev’s Inequalities for Random Variables.
-
- The normal approximation, standard units for random variables, the normal curve, the normal approximation to probability histograms, the continuity correction, the normal approximation to the hypergeometric distribution, Markov’s and Chebychev’s inequalities for random variables, summary, key terms.
- Chapter 24, Sampling.
-
- Parameters and statistics, why sample?, sample surveys, The Hite Report, bias in surveys, Sampling designs: cluster sampling, stratified sampling, multistage sampling, hybrid designs, ways of drawing samples, convenience samples, quota samples, systematic samples, probability samples, simple random samples, systematic random samples, Sampling from hypothetical populations, summary, key terms.
- Chapter 25, Estimating Parameters from Simple Random Samples.
-
- Quantifying the error of estimators: bias, standard error, and mean squared error, estimating means and percentages, a conservative estimate of the SE of the sample percentage, the Bootstrap estimate of the SD of a list of zeros and ones, the sample standard deviation and the sample variance, caveats, summary, key terms.
- Chapter 26, Confidence Intervals.
-
- Confidence intervals, conservative confidence intervals for percentages, conservative confidence intervals for the mean of bounded populations, approximate confidence intervals for percentages, approximate confidence intervals for the population mean, exact confidence intervals for percentages, confidence intervals for the median and percentiles, summary.
- Chapter 27, Hypothesis Testing: Does Chance explain the Results?.
-
- Hypothesis testing, Examples of hypothesis testing problems, significance level and power, test statistics and P-values, hypotheses about parameters; one-sided and two-sided alternatives, case study: employment discrimination, caveats, the meaning of rejection, statistical significance and practical importance, interpreting P-values, multiplicity and data mining, garbage in, garbage out, summary.
- Chapter 28, Does Treatment Have an Effect?.
-
- The Method of Comparison, confounding, historical controls, longitudinal and cross-sectional comparisons, Simpson’s Paradox, experiments and observational studies, assessing online instructions, the Placebo Effect, John Snow’s study of the mode of communication of cholera, The Kassel Dowsing Experiment, summary.
- Chapter 29, Testing Equality of Two Percentages.
-
- Fisher’s Exact Test for an effect–dependent samples, the normal approximation to Fisher’s Exact Test, testing equality of two percentages using independent samples, Fisher’s Exact Test using independent samples, the Z test for the equality of two percentages using independent Samples, the normal approximation to Fisher’s exact test and the z Test, summary, key terms.
- Chapter 30, Approximate Hypothesis Tests: the z Test and the t Test.
-
- z Tests, P values for z tests, examples of z tests, z test for a population percentage, the z test for a population mean, z-test for a difference of population means (paired samples, independent samples), t tests, nearly normally distributed populations, Student’s t-curve, t test for the mean of a nearly normal population, hypothesis tests and confidence intervals, confidence intervals using Student’s t curve, summary, key terms
- Chapter 31, The Multinomial Distribution and the Chi-Squared Test for Goodness of Fit.
Tags: Estat Descritiva, inferência
Tutorial: How to detect spurious correlations
Posted by Armando Brito Mendes | Filed under estatística, materiais ensino

Uso de métodos robustos para identiicar correlações espúrias
Tutorial: How to detect spurious correlations, and how to find the real ones
Specifically designed in the context of big data in our research lab, the new and simple strong correlation synthetic metric proposed in this article should be used, whenever you want to check if there is a real association between two variables, especially in large-scale automated data science or machine learning projects. Use this new metric now, to avoid being accused of reckless data science and even being sued for wrongful analytic practice.
Tags: data mining, Estat Descritiva, inferência