Repulsive Curves
Posted by Armando Brito Mendes | Filed under materiais para profissionais, refs bibliográficas, visualização

Um trabalho muito interessante e com muito código sobre os melhores algoritmos para construir curvas que não se sobrepõem
Curves play a fundamental role across computer graphics, physical simulation, and mathematical visualization, yet most tools for curve design do nothing to prevent crossings or self-intersections. This paper develops efficient algorithms for (self-)repulsion of plane and space curves that are well-suited to problems in computational design. Our starting point is the so-called tangent-point energy, which provides an infinite barrier to self-intersection. In contrast to local collision detection strategies used in, e.g., physical simulation, this energy considers interactions between all pairs of points, and is hence useful for global shape optimization: local minima tend to be aesthetically pleasing, physically valid, and nicely distributed in space. A reformulation of gradient descent, based on a Sobolev-Slobodeckij inner product enables us to make rapid progress toward local minima—independent of curve resolution. We also develop a hierarchical multigrid scheme that significantly reduces the per-step cost of optimization. The energy is easily integrated with a variety of constraints and penalties (e.g., inextensibility, or obstacle avoidance), which we use for applications including curve packing, knot untangling, graph embedding, non-crossing spline interpolation, flow visualization, and robotic path planning.
Map of Best Breweries in America
Posted by Armando Brito Mendes | Filed under Investigação Operacional, mapas SIG's, visualização
clicar na imagem para seguir o link
Um mapa com as melhores produtoras de cerveja artesanal nos EUA e uma rota otimizada com algoritmos genéticos
RateBeer puts out a list every year for top 100 breweries in the world. The rankings are based on reviews, range across styles, and historical performance (and maybe a bit of subjectivity). RateBeer just published the list for 2018. Here’s a map of the 73 U.S.-based breweries.
Brewery Road Trip, Optimized With Genetic Algorithm
Now that we know where they are, let’s find out how to visit all of them in one go.
Tags: belo, grafos, mapas, otimização, R-software, SIG
norsecorp cyber attack info
Posted by Armando Brito Mendes | Filed under mapas SIG's, visualização

clique na imagem para seguir o link
Um site dinâmico q mapeia informação sobre ciberataques em tempo real
Markov Chains explained visually
Posted by Armando Brito Mendes | Filed under Investigação Operacional, matemática, materiais ensino, visualização
Boa forma de perceber como funcionam as cadeias de Markov
Adding on to their series of graphics to explain statistical concepts, Victor Powell and Lewis Lehe use a set of interactives to describe Markov Chains. Even if you already know what Markov Chains are or use them regularly, you can use the full-screen version to enter your own set of transition probabilities. Then let the simulation run.
Tags: grafos, otimização
9 “must read” articles on Big Data
Posted by Armando Brito Mendes | Filed under estatística, materiais para profissionais, visualização
Textos para big data
My selection
- Big Data – From Descriptive to Prescriptive
- Can big data be racist?
- NodeXL Graph Gallery: Graph Details
- Best Metrics For Digital Marketing: Rock Your Own And Rent Strategies
- Big Data: from mining to meaning
- Beautiful versus useful visualizations (in French, but interesting)
- Learning and Teaching Machine Learning: A Personal Journey
- Big data techniques and technologies
- The Sexiest Job of the 21st Century is Tedious, and that Needs to C… (*)
- From the trenches: 360-degree data science
(*) I disagree with this Harvard Business Review author. Senior data scientists work on high level data from various sources, use automated processes for EDA (exploratory analysis) and spend little to no time in tedious, routine, mundane tasks (less than 5% of my time, in my case). I also use robust techniques that work well on relatively dirty data, and … I create and design the data myself in many cases.
Tags: belo, big data, data mining, Estat Descritiva, grafos
Introduction to social network methods
Posted by Armando Brito Mendes | Filed under ARS - SNA, materiais ensino
Um bom livro online sobre SNA
Robert A. Hanneman and Mark Riddle
Introduction to social network methods
Table of contents
About this book
This on-line textbook introduces many of the basics of formal approaches to the analysis of social networks. The text relies heavily on the work of Freeman, Borgatti, and Everett (the authors of the UCINET software package). The materials here, and their organization, were also very strongly influenced by the text of Wasserman and Faust, and by a graduate seminar conducted by Professor Phillip Bonacich at UCLA. Many other users have also made very helpful comments and suggestions based on the first version. Errors and omissions, of course, are the responsibility of the authors.
You are invited to use and redistribute this text freely — but please acknowledge the source.
Hanneman, Robert A. and Mark Riddle. 2005. Introduction to social network methods. Riverside, CA: University of California, Riverside ( published in digital form athttp://faculty.ucr.edu/~hanneman/ )
Table of contents:
Preface
1. Social network data
2. Why formal methods?
3. Using graphs to represent social relations
4. Working with Netdraw to visualize graphs
5. Using matrices to represent social relations
6. Working with network data
7. Connection
8. Embedding
9. Ego networks
10. Centrality and power
11. Cliques and sub-groups
12. Positions and roles: The idea of equivalence
13. Measures of similarity and structural equivalence
14. Automorphic equivalence
15. Regular equivalence
16. Multiplex networks
17. Two-mode networks
18. Some statistical tools
After word
Bibliography
Tags: ARS\SNA applicações, ARS\SNA intro, grafos
IFORS Network_Flow_Problems
Posted by Armando Brito Mendes | Filed under Investigação Operacional, materiais ensino, planeamento

Algoritmos e Problemas de Redes
The following 10 pages are in this category, out of 10 total.
ACFG |
IMN |
N cont.T |
Tags: grafos, otimização, software de otimização
Lexical Distance Among the Languages of Europe
Posted by Armando Brito Mendes | Filed under Investigação Operacional, visualização

Um bom exemplo de aplicação de redes como visualização à proximidade das linguas Europeias
This chart shows the lexical distance — that is, the degree of overall vocabulary divergence — among the major languages of Europe.
The size of each circle represents the number of speakers for that language. Circles of the same color belong to the same language group. All the groups except for Finno-Ugric (in yellow) are in turn members of the Indo-European language family.
English is a member of the Germanic group (blue) within the Indo-European family. But thanks to 1066, William of Normandy, and all that, about 75% of the modern English vocabulary comes from French and Latin (ie the Romance languages, in orange) rather than Germanic sources. As a result, English (a Germanic language) and French (a Romance language) are actually closer to each other in lexical terms than Romanian (a Romance language) and French.
Tags: ARS\SNA applicações, belo, data mining, grafos
Century of rock history
Posted by Armando Brito Mendes | Filed under visualização

Para quem gosta de música esta visualização é extraordinária
Jessica Edmondson visualized the history of rock music, from foundations in the pre-1900s to a boom in the 1960s and finally to what we have now. Nodes represent music styles, and edges represent musical connections. There are a lot of them and as a whole it’s a screen of spaghetti, but it’s animated, which is key. It starts at the beginning and develops over time, so you know where to go and what to look at. Music samples for each genre is also a nice touch. [Thanks, Jessica]
Tags: ARS\SNA applicações, ARS\SNA intro, belo, captura de conhecimento, grafos
Using Metadata to Find Paul Revere
Posted by Armando Brito Mendes | Filed under ARS - SNA, visualização
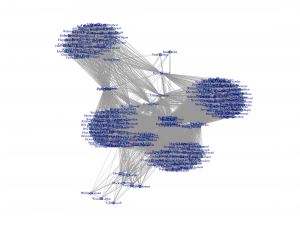
Um exemplo de um estudo de redes sociais
It’s just metadata. What can you do with that? Kieran Healy, a sociology professor at Duke University, shows what you can do, with just some basic social network analysis. Using metadata from Paul Revere’s Ride on the groups that people belonged to, Healy sniffs out Paul Revere as a main target. Bonus points for writing the summary from the point of a view of an 18th century analyst.
What a nice picture! The analytical engine has arranged everyone neatly, picking out clusters of individuals and also showing both peripheral individuals and—more intriguingly—people who seem to bridge various groups in ways that might perhaps be relevant to national security. Look at that person right in the middle there. Zoom in if you wish. He seems to bridge several groups in an unusual (though perhaps not unique) way. His name is Paul Revere.
You can grab the R code and dataset on github, too, if you want to follow along.
Tags: ARS\SNA applicações, ARS\SNA intro, belo, grafos