Earliest Known Uses of Words of Mathematics
Posted by Armando Brito Mendes | Filed under estatística, matemática, materiais ensino

um curioso site onde se registam os significados mais antigos para termos matemáticos
These pages attempt to show the first uses of various words used in mathematics. Research for these pages is ongoing, and a citation should not be assumed to be the earliest use unless it is indicated as such.
Mathematical Words: Origins and Sources by John Aldrich is an excellent article and companion to this web site.
Please see also Earliest Uses of Various Mathematical Symbols, Images of Mathematicians on Postage Stamps, and Ambiguously Defined Mathematical Terms at the High School Level.
These pages are maintained by Jeff Miller, a teacher at Gulf High School in New Port Richey, Florida. The principal contributors are John Aldrich, Julio González Cabillón, Carlos César de Araújo, and James A. Landau. Other contributors are Manoel de Campos Almeida, Antranig Basman, Dave Cohen, John Conway, Martin Davis, Karen Dee Michalowicz, Joanne M. Despres of Merriam-Webster Inc., Bill Dubuque, Mark Dunn, John G. Fauvel, Walter Felscher, Giovanni Ferraro, Tom Foregger, Michael N. Fried, John Harper, Antreas P. Hatzipolakis, Barnabas Hughes, Samuel S. Kutler, Franz Lemmermeyer, Avinoam Mann, Peter M. Neumann, Ken Pledger, Paul Pollack, Jim Propp, Aldo I. Ramirez, Lee Rudolph, Randy K. Schwartz, Max Urchs, Tom Walsh, William C. Waterhouse, and David Wilkins.
“Perhaps I may without immodesty lay claim to the appellation of Mathematical Adam, as I believe that I have given more names (passed into general circulation) of the creatures of mathematical reason than all the other mathematicians of the age combined.” —James Joseph Sylvester, Nature 37 (1888), p. 152.
Tags: definição
Real Chart Rules to Follow
Posted by Armando Brito Mendes | Filed under estatística, materiais ensino, visualização
clicar na imagem para seguir o link
Excelente guia sobre construção de gráficos para representar dados.
There are a lot of “rules” for visualization. Some are actual rules, and some are suggestions to help you make choices. Many of the former can be broken, if that’s what the data dictates and you know what you’re doing.
But, there are rules—usually for specific chart types meant to be read in a specific way and with few exceptions—that you shouldn’t break. When they are, everyone loses. This is that small handful.
Tags: data mining, definição, Estat Descritiva, R-software
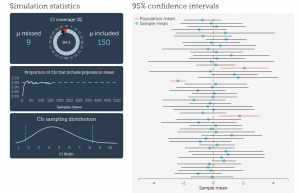
visualização do intervalo de confiança
Posted by Armando Brito Mendes | Filed under estatística, materiais ensino, visualização
clicar na imagem para seguir o link
Boa forma de visualizar o conceito de Intervalo de Confiança Aleatório.
About the visualization
Some say that a shift from hypothesis testing to confidence intervals and estimation will lead to fewer statistical misinterpretations. Personally, I am not sure about that. But I agree with the sentiment that we should stop reducing statistical analysis to binary decision-making. The problem with CIs is that they are as unintuitive and as misunderstood p-values and null hypothesis significance testing. Moreover, CIs are often used to perform hypothesis tests and are therefore prone to the same misuses as p-values.
Tags: belo, definição, inferência
What is probabilistic programming?
Posted by Armando Brito Mendes | Filed under materiais para profissionais, software
Uma nova forma de trabalhar com modelos Bayesianos!
«
In this post, I introduce the emerging area of probabilistic programming, showing how probabilistic programs will hopefully make it easier to perform Bayesian-style machine learning, among other applications. Probabilistic programming is an exciting, and growing, area of research, with fantastic people in both AI/ML and PL working together and making big strides. PL methods — including formal semantics, optimization techniques, and forms of static analysis — have proven very useful in advancing this area forward.
Tags: bioinformatica, data mining, decisão médica, definição, desnvolvimento de software, qualidade
Why use R? Five reasons
Posted by Armando Brito Mendes | Filed under materiais para profissionais, software
Bom blogue, as principais razões para usar R
Why use R? Five reasons.
In this post I will go through 5 reasons: zero cost, crazy popularity, awesome power, dazzling flexibility, and mind-blowing support. I believe R is the best statistical programming language to learn. As a blogger who has contributed over 150 posts in Stata and over 100 in R I have extensive experience with both a proprietary statistical programming language as well as the open source alternative. In my graduate career I have also had the opportunity to experiment with the proprietary software SPSS, SAS, Mathematica, as well as MPlus.
Tags: big data, definição, R-software, software estatístico
Exponential water tank
Posted by Armando Brito Mendes | Filed under estatística, materiais ensino, visualização

Uma excelente forma de perceber a distribuição exponencial
Hibai Unzueta, based on a paper by Albert Bartlett, demonstrates exponential growth with a simple animation. It depicts a man standing in a tank with finite capacity and water rising slowly, but at an exponential rate.
Our brains are wired to predict future behaviour based on past behaviour (see here). But what happens when something growths exponentially? For a long time, the numbers are so little in relation to the scale that we hardly see the changes. But even at moderate growth rates exponential functions reach a point where the numbers grow too fast. Once we confirm that our predictions about the future have failed, very little time to react may be left.
All looks safe at first, because the water rises so slowly, but it seems to rise all of a sudden. Oh, the suspense. What will happen to cartoon pixel man?
Tags: definição, inferência
A fábrica de Lego e o Lean Six Sigma
Posted by Armando Brito Mendes | Filed under materiais ensino, planeamento, videos
Uma animação com exemplo de aplicação do lean six sigma
Neste vídeo, uma fábrica de Lego cuja situação era de caos e desastre torna-se um exemplo de gestão, após a aplicação dos conceitos de Lean Six Sigma.
Tags: análise de sistemas, definição, gestão de projetos, modelos empresariais
Como otimizar um processo de negócio
Posted by Armando Brito Mendes | Filed under Investigação Operacional, software
Business Process Management (BPM) explicado por um consultor
Neste artigo apresentarei uma técnica prática e eficaz para o aprimoramento dos processos corporativos, o mapeamento de processos. Esta técnica é apenas a ponta do iceberg de um tema muito mais abrangente denominado Business Process Management (BPM), ou Gestão por Processos de Negócio. Explicarei brevemente a metodologia de BPM, seus benefícios e ferramentas, mas o foco de nossa conversa é o primeiro passo desta metodologia o MAPEAMENTO DE PROCESSOS.
Tags: análise de sistemas, definição, modelos empresariais, qualidade
Introduction to Diagrams
Posted by Armando Brito Mendes | Filed under ARS - SNA, Investigação Operacional, videos, visualização

Uma bela introdução aos grafos
Diagrams are everywhere — from the established conventions of highway signs to the newly emerging visualizations appearing on social networking websites. Most people have a personal experience of diagrams whether drawing directions or figuring out how to operate a new computer. Yet very few people are familiar with how we read or construct diagrams.
This short film introduces the language of diagrams and their role in visual thinking and communication. As only a film can do, it reveals the vocabulary “in the wild” and in the context of making and using diagrams.
Tags: ARS\SNA intro, definição
Mathematics resources – mathcentre
Posted by Armando Brito Mendes | Filed under matemática, materiais ensino

Materiais para as aulas: Análise e álgebra
![]() Quick Reference leaflets – key topics in a nutshell – brief and easily accessible resources
Quick Reference leaflets – key topics in a nutshell – brief and easily accessible resources
![]() mathtutor Video tutorials – watch and listen to a tutor working through important topics
mathtutor Video tutorials – watch and listen to a tutor working through important topics
![]() Teach Yourself booklets – written to accompany the videos, these provide in-depth treatment of important topics, with theory, worked examples and exercises
Teach Yourself booklets – written to accompany the videos, these provide in-depth treatment of important topics, with theory, worked examples and exercises
![]() Practice & Revision booklets – hundreds of practice exercises with answers covering important topics in algebra and calculus
Practice & Revision booklets – hundreds of practice exercises with answers covering important topics in algebra and calculus
![]() On-line Test Yourself diagnostics – on specific topics to enable you to gauge your competency and decide whether further work is required
On-line Test Yourself diagnostics – on specific topics to enable you to gauge your competency and decide whether further work is required
![]() On-line Test Yourself exercises – with answers provided, to enable you to practice key techniques
On-line Test Yourself exercises – with answers provided, to enable you to practice key techniques
![]() on-line exercises and fully worked solutions generated from the STACK computer-assisted assessment system and linked directly from selected Teach Yourself booklets
on-line exercises and fully worked solutions generated from the STACK computer-assisted assessment system and linked directly from selected Teach Yourself booklets
![]() iPOD Video segments – short video clips that you can download to your video iPod for support on the move
iPOD Video segments – short video clips that you can download to your video iPod for support on the move
![]() 3GP Mobile Phone downloads – short video clips that you can download to your mobile phone
3GP Mobile Phone downloads – short video clips that you can download to your mobile phone
![]() Facts & Formulae Leaflets – electronic versions of the very popular leaflets distributed by the Higher Education Academy MSOR Subject Centre
Facts & Formulae Leaflets – electronic versions of the very popular leaflets distributed by the Higher Education Academy MSOR Subject Centre
![]() Motivating Mathematics – videos showing practical applications of mathematics in everyday life
Motivating Mathematics – videos showing practical applications of mathematics in everyday life
Staff Resources – a selection of case studies, resource packs, links to key reports and research on mathematics support, and other valuable resources for staff who offer mathematics support
Tags: b-learning, definição