Survs: Ferramenta para inquéritos on-line
Posted by Armando Brito Mendes | Filed under estatística, software

Boa ferramenta para construção de inquéritos on-line
Create online surveys with your team easily and efficiently.
Survs is a web-based tool to create, distribute, and analyze online surveys. Its friendly interface and compelling features provide everything you need to get feedback.
Tags: inquéritos, software estatístico
List of R Resources
Posted by Armando Brito Mendes | Filed under estatística, materiais para profissionais, software
muito boa lista de recursos sobre R
There is a wealth of resources on the Web and elsewhere to learn more about R. Here are some of the best.
Tags: data mining, Estat Descritiva, R-software, software estatístico
Introduction to R for SAS and SPSS Users
Posted by Armando Brito Mendes | Filed under estatística, materiais para profissionais
algumas comparações e conselhos úteis
R is free software for data analysis and graphics that is similar to SAS and SPSS. Two million people are part of the R Open Source Community. Its use is growing very rapidly and Revolution Analytics distributes a commercial version of R that adds capabilities that are not available in the Open Source version. This 60-minute webinar is for people who are familiar with SAS or SPSS who want to know how R can strengthen their analytics strategy. It will include:
- What R is and how it compares to SAS and SPSS
- An overview of how to install and maintain it
- How to find R add-on modules comparable to those for SAS and SPSS
- Which of R’s many user interfaces are most like those of SAS and SPSS
- How to run R from within SAS and SPSS
- What a simple R program looks like
- Q&A with Bob Muenchen
Repaly the webcast and find out how SAS and SPSS users can take advantage of R.
Tags: data mining, IBM SPSS Statistics, R-software, software estatístico
Data Mining for Business Intelligence
Posted by Armando Brito Mendes | Filed under materiais ensino, SAD - DSS
Livro completo no google books com boa introdução ao data mining
Índice
Tags: captura de conhecimento, data mining, Excel, programação em folha de cálculo, software estatístico
Advanced Statistics
Posted by Armando Brito Mendes | Filed under estatística, materiais ensino, software, visualização

Bons slides e outros materiais sobre clusters, AFE, SEM, reg logistica, meta-análise, MANOVA, Reliability
Welcome to Malbowges, the part of Nether Hell dominated by thieves, counsellors of Fraud (or should that just be counsellors), falsifiers and sowers of discord. It’s not a nice place for Sunday lunch. You must wade through rivers of Lucifer’s sputum to reach the answers you seek, and when you find those answers, you’ll probably wish you hadn’t bothered. Revenge is mine, ah ha ha, yah ha ha, ya ha ha ha ha ha ha ha ha ha …
Tags: captura de conhecimento, data mining, decisão médica, IBM SPSS Statistics, inferência, software estatístico
Introductory Statistics
Posted by Armando Brito Mendes | Filed under estatística, materiais ensino, videos, visualização
Muito boas aulas e slides sobre testes não paramétricos e SPSS
Welcome to Limbo, where the lustful, gluttonous and wrathful wander in endless torment. Here you can uncover the searing agony of SPSS, the stomach churning fear of central tendency and the rancid bile of z-scores. Good luck, you’ll need it.
Tags: análise de dados, captura de conhecimento, data mining, decisão médica, Estat Descritiva, IBM SPSS Statistics, inferência, inquéritos, software estatístico
Intermediate Statistics
Posted by Armando Brito Mendes | Filed under estatística, materiais ensino, software, videos
Muito boas aulas e slides sobre ANOVA, ANCOVA e regressão
Welcome to the wood of suicides (is anyone getting all these Dante references or am I just wasting my time here?), where self flagellation is the name of the game. You will experience the bowel-evacuating effect of multiple regression, the bone-splintering power of ANOVA and the nose-hair pulling torment of factor analysis. Can you cope: I think not, mortal filth. Be warned, your brain will be placed in a jar of cerebral fluid and I will toy with it at my leisure.
Tags: decisão médica, IBM SPSS Statistics, inferência, software estatístico
PANDA – Practical Analysis of Nutritional Data
Posted by Armando Brito Mendes | Filed under estatística, materiais ensino, software, visualização

Bom livro sobre análise de dados e testes estatísticos
Chapter 1 – USING NUTRITIONAL DATA
Chapter 2 – DATA CLEANING
Chapter 3 – ONE-WAY ANALYSIS
Chapter 4 – TWO-WAY ANALYSIS
Chapter 5 – MULTI-WAY ANALYSIS
Chapter 6 – SUBMODULES
Chapter 7 – ASSESS YOUR UNDERSTANDING
Chapter 8 – KENYA REAL WORLD ANALYSIS
Building and presenting a situation analysis
Child Feeding Practices
Tags: análise de dados, decisão médica, Estat Descritiva, IBM SPSS Statistics, inferência, software estatístico
Determining the Number of Components and Factors Using Parallel Analysis and Velicer’s MAP Test
Posted by Armando Brito Mendes | Filed under estatística, software, visualização
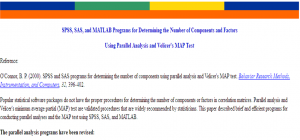
Softwere para análise do nº de componentes em ACP e AF
Popular statistical software packages do not have the proper procedures for determining the number of components or factors in correlation matrices. Parallel analysis and Velicer’s minimum average partial (MAP) test are validated procedures that are widely recommended by statisticians. This paper described brief and efficient programs for conducting parallel analyses and the MAP test using SPSS, SAS, and MATLAB.
Métodos para facilitar a interpretação da AFE
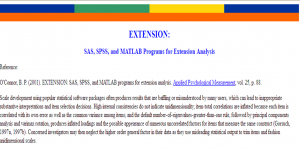
Scale development using popular statistical software packages often produces results that are baffling or misunderstood by many users, which can lead to inappropriate substantive interpretations and item selection decisions. High internal consistencies do not indicate unidimensionality; item-total correlations are inflated because each item is correlated with its own error as well as the common variance among items; and the default number-of-eigenvalues-greater-than-one rule, followed by principal components analysis and varimax rotation, produces inflated loadings and the possible appearance of numerous uncorrelated factors for items that measure the same construct (Gorsuch, 1997a, 1997b). Concerned investigators may then neglect the higher order general factor in their data as they use misleading statistical output to trim items and fashion unidimensional scales.
These problems can be circumvented in exploratory factor analysis by using more appropriate factor analytic procedures and by using extension analysis as the basis for adding items to scales. Extension analysis provides correlations between nonfactored items and the factors that exist in a set of core items. The extension item correlations are then used to decide which factor, if any, a prospective item belongs to. The decisions are unbiased because factors are defined without being influenced by the extension items. One can also examine correlations between extension items and any higher order factor(s) in the core items. The end result is a comprehensive, undisturbed, and informative picture of the correlational structure that exists in a set of core items and of the potential contribution and location of additional items to the structure.
Tags: análise de dados, captura de conhecimento, decisão médica, desnvolvimento de software, IBM SPSS Statistics, software estatístico
SPSS Programs for Analyzing Lag-Sequential Categorical Data
Posted by Armando Brito Mendes | Filed under estatística, materiais ensino, software
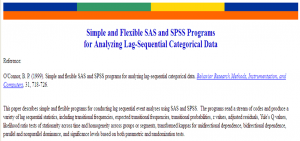
Programas em SPSS e SAS para análise de séries categóricas
This paper describes simple and flexible programs for conducting lag sequential event analyses using SAS and SPSS. The programs read a stream of codes and produce a variety of lag sequential statistics, including transitional frequencies, expected transitional frequencies, transitional probabilities, z values, adjusted residuals, Yule’s Q values, likelihood ratio tests of stationarity across time and homogeneity across groups or segments, transformed kappas for unidirectional dependence, bidirectional dependence, parallel and nonparallel dominance, and significance levels based on both parametric and randomization tests.
Tags: captura de conhecimento, data mining, desnvolvimento de software, IBM SPSS Statistics, previsão, qualidade, software estatístico