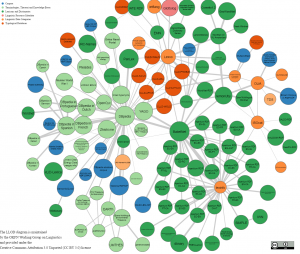
Machine Learning and Data Science Cheat Sheet
Posted by Armando Brito Mendes | Filed under Uncategorized

clique na imagem para seguir o link
Pequeno tutorial (com muitos links) sobre linux e machine learning
You can download the new machine learning cheat sheet here (PDF format, 14 pages.)
Originally published in 2014 and viewed more than 200,000 times, this is the oldest data science cheat sheet – the mother of all the numerous cheat sheets that are so popular nowadays. I decided to update it in June 2019. While the first half, dealing with installing components on your laptop and learning UNIX, regular expressions, and file management hasn’t changed much, the second half, dealing with machine learning, was rewritten entirely from scratch. It is amazing how things have changed in just five years!
Tags: data mining, Linux, machine learning
Making of the Illustrations of the Natural Orders of Plants
Posted by Armando Brito Mendes | Filed under materiais para profissionais
![]() clique na imagem para seguir o link
clique na imagem para seguir o link
If someone told me when I was young that I would spend three months of my time tracing nineteenth century botanical illustrations and enjoy it, I would have scoffed, but that’s what I did to reproduce Elizabeth Twining’s Illustrations of the Natural Orders of Plants and I loved every minute.
After the unexpected successes of my Byrne’s Euclid and Werner’s Nomenclature of Colours projects (for which I’m very grateful) I got the itch to follow them up with another reproduction of an obscure catalog from the 1800s. However, finding interesting obscure catalogs want an easy task when I didn’t know what would pique my interest. Anything was fair game but I had an inkling that something based on the sciences would be most interesting. Scientific catalogs are organized, structured, and data can be extracted from them with some elbow grease.
Tags: belo, captura de conhecimento, data mining, machine learning
Posted by Armando Brito Mendes | Filed under estatística
clique na imagem para seguir o link
Bom texto com conclusões exclusivas
1. Re-sampling and Statistical Inference
- Main Result
- Sampling with or without Replacement
- Illustration
- Optimum Sample Size
- Optimum K in K-fold Cross-Validation
- Confidence Intervals, Tests of Hypotheses
2. Generic, All-purposes Algorithm
- Re-sampling Algorithm with Source Code
- Alternative Algorithm
- Using a Good Random Number Generator
3. Applications
- A Challenging Data Set
- Results and Excel Spreadsheet
- A New Fundamental Statistics Theorem
- Some Statistical Magic
- How does this work?
- Does this contradict entropy principles?
4. Conclusions
Tags: data mining, inferência, machine learning
The 5 Computer Vision Techniques
Posted by Armando Brito Mendes | Filed under lições, materiais ensino
clique na imagem para seguir o link
Boa introdução ao tema da visão por computador
The 5 Computer Vision Techniques That Will Change How You See The World
Computer Vision is one of the hottest research fields within Deep Learning at the moment. It sits at the intersection of many academic subjects, such as Computer Science (Graphics, Algorithms, Theory, Systems, Architecture), Mathematics (Information Retrieval, Machine Learning), Engineering (Robotics, Speech, NLP, Image Processing), Physics (Optics), Biology (Neuroscience), and Psychology (Cognitive Science). As Computer Vision represents a relative understanding of visual environments and their contexts, many scientists believe the field paves the way towards Artificial General Intelligence due to its cross-domain mastery.
So what is Computer Vision?
Tags: data mining, machine learning, robot
How To Use Multivariate Time Series Techniques For Capacity Planning on VMs
Posted by Armando Brito Mendes | Filed under estatística, Investigação Operacional, materiais ensino
clique na imagem para seguir o link
Métodos multivariados para séries cronológicas com VMs
Capacity planning is an arduous, ongoing task for many operations teams, especially for those who rely on Virtual Machines (VMs) to power their business. At Pivotal, we have developed a data science model capable of forecasting hundreds of thousands of models to automate this task using a multivariate time series approach. Open to reuse for other areas such as industrial equipment or vehicles engines, this technique can be applied broadly to anything where regular monitoring data can be collected.
Tags: data mining, machine learning, previsão
Recurrent neural networks, Time series data and IoT – Part One
Posted by Armando Brito Mendes | Filed under estatística, Investigação Operacional, materiais ensino
clique na imagem para seguir o link
Utilização de redes neuronais para previsão de séries univariadas
RNNs are already used for Time series analysis. Because IoT problems can often be modelled as a Time series, RNNs could apply to IoT data. In this multi-part blog, we first discuss Time series applications and then discuss how RNNs could apply to Time series applications. Finally, we discuss applicability to IoT.
In this article (Part One), we present the overall thought process behind the use of Recurrent neural networks and Time series applications – especially a type of RNN called Long Short Term Memory networks (LSTMs).
Tags: data mining, machine learning, previsão
An Introduction to Word Embeddings
Posted by Armando Brito Mendes | Filed under Uncategorized
bom texto sobre uma técnica em NLP – Natural Language Pocessing
Part 1: Applications
Written by Aaron Geelon So
If you already have a solid understanding of word embeddings and are well into your data science career, skip ahead to the next part!
Human language is unreasonably effective at describing how we relate to the world. With a few, short words, we can convey many ideas and actions with little ambiguity. Well, mostly.
Because we’re capable of seeing and describing so much complexity, a lot of structure is implicitly encoded into our language. It is no easy task for a computer (or a human, for that matter) to learn natural language, for it entails understanding how we humans observe the world, if not understanding how to observe the world.
For the most part, computers can’t understand natural language. Our programs are still line-by-line instructions telling a computer what to do — they often miss nuance and context. How can you explain sarcasm to a machine?
There’s good news though. There’s been some important breakthroughs in natural language processing (NLP), the domain where researchers try to teach computers human language.
Tags: data mining, machine learning, text mining
An Introduction to Implementing Neural Networks using TensorFlow
Posted by Armando Brito Mendes | Filed under materiais ensino, software

clicar na imagem para seguir o link
Uma boa introdução ao tensor flow e deep learning
Introduction
If you have been following Data Science / Machine Learning, you just can’t miss the buzz around Deep Learning and Neural Networks. Organizations are looking for people with Deep Learning skills wherever they can. From running competitions to open sourcing projects and paying big bonuses, people are trying every possible thing to tap into this limited pool of talent. Self driving engineers are being hunted by the big guns in automobile industry, as the industry stands on the brink of biggest disruption it faced in last few decades!
If you are excited by the prospects deep learning has to offer, but have not started your journey yet – I am here to enable it. Starting with this article, I will write a series of articles on deep learning covering the popular Deep Learning libraries and their hands-on implementation.
In this article, I will introduce TensorFlow to you. After reading this article you will be able to understand application of neural networks and use TensorFlow to solve a real life problem. This article will require you to know the basics of neural networks and have familiarity with programming. Although the code in this article is in python, I have focused on the concepts and stayed as language-agnostic as possible.
Let’s get started!
Table of Contents
- When to apply neural nets?
- General way to solve problems with Neural Networks
- Understanding Image data and popular libraries to solve it
- What is TensorFlow?
- A typical “flow” of TensorFlow
- Implementing MLP in TensorFlow
- Limitations of TensorFlow
- TensorFlow vs. other libraries
- Where to go from here?
Tags: big data, data mining, machine learning, text mining
MARS – Multivariate Adaptive Regression Splines
Posted by Armando Brito Mendes | Filed under materiais ensino, materiais para profissionais
clique na imagem para seguir o link
Boa descrição destes algoritmos de análise de dados pelos proprios autores
An Overview of MARS
What is “MARS”?
MARS®, an acronym for Multivariate Adaptive Regression Splines, is a multivariate non-parametric regression procedure introduced in 1991 by world-renowned Stanford statistician and physicist, Jerome Friedman (Friedman, 1991). Salford Systems’ MARS, based on the original code, has been substantially enhanced with new features and capabilities in exclusive collaboration with Friedman.
Tags: análise de dados, data mining, machine learning
Tinker With a Neural Network
Posted by Armando Brito Mendes | Filed under software, visualização

clique na imagem para seguir o link
Uma excelente aplicação web para perceber como as redes neuronais funcionam
Um, What Is a Neural Network?
It’s a technique for building a computer program that learns from data. It is based very loosely on how we think the human brain works. First, a collection of software “neurons” are created and connected together, allowing them to send messages to each other. Next, the network is asked to solve a problem, which it attempts to do over and over, each time strengthening the connections that lead to success and diminishing those that lead to failure. For a more detailed introduction to neural networks, Michael Nielsen’s Neural Networks and Deep Learning is a good place to start. For a more technical overview, try Deep Learning by Ian Goodfellow, Yoshua Bengio, and Aaron Courville.
This Is Cool, Can I Repurpose It?
Please do! We’ve open sourced it on GitHub with the hope that it can make neural networks a little more accessible and easier to learn. You’re free to use it in any way that follows our Apache License. And if you have any suggestions for additions or changes, please let us know.
We’ve also provided some controls below to enable you tailor the playground to a specific topic or lesson. Just choose which features you’d like to be visible below then save this link, or refresh the page.
What Do All the Colors Mean?
Orange and blue are used throughout the visualization in slightly different ways, but in general orange shows negative values while blue shows positive values.
The data points (represented by small circles) are initially colored orange or blue, which correspond to positive one and negative one.
In the hidden layers, the lines are colored by the weights of the connections between neurons. Blue shows a positive weight, which means the network is using that output of the neuron as given. An orange line shows that the network is assiging a negative weight.
In the output layer, the dots are colored orange or blue depending on their original values. The background color shows what the network is predicting for a particular area. The intensity of the color shows how confident that prediction is.
What Library Are You Using?
We wrote a tiny neural network library that meets the demands of this educational visualization. For real-world applications, consider the TensorFlow library.
Credits
This was created by Daniel Smilkov and Shan Carter. This is a continuation of many people’s previous work — most notably Andrej Karpathy’s convnet.js demo and Chris Olah’s articles about neural networks. Many thanks also to D. Sculley for help with the original idea and to Fernanda Viégas and Martin Wattenberg and the rest of the Big Picture and Google Brain teams for feedback and guidance.
Tags: data mining, machine learning, web apps