Introduction to social network methods
Posted by Armando Brito Mendes | Filed under ARS - SNA, materiais ensino
Um bom livro online sobre SNA
Robert A. Hanneman and Mark Riddle
Introduction to social network methods
Table of contents
About this book
This on-line textbook introduces many of the basics of formal approaches to the analysis of social networks. The text relies heavily on the work of Freeman, Borgatti, and Everett (the authors of the UCINET software package). The materials here, and their organization, were also very strongly influenced by the text of Wasserman and Faust, and by a graduate seminar conducted by Professor Phillip Bonacich at UCLA. Many other users have also made very helpful comments and suggestions based on the first version. Errors and omissions, of course, are the responsibility of the authors.
You are invited to use and redistribute this text freely — but please acknowledge the source.
Hanneman, Robert A. and Mark Riddle. 2005. Introduction to social network methods. Riverside, CA: University of California, Riverside ( published in digital form athttp://faculty.ucr.edu/~hanneman/ )
Table of contents:
Preface
1. Social network data
2. Why formal methods?
3. Using graphs to represent social relations
4. Working with Netdraw to visualize graphs
5. Using matrices to represent social relations
6. Working with network data
7. Connection
8. Embedding
9. Ego networks
10. Centrality and power
11. Cliques and sub-groups
12. Positions and roles: The idea of equivalence
13. Measures of similarity and structural equivalence
14. Automorphic equivalence
15. Regular equivalence
16. Multiplex networks
17. Two-mode networks
18. Some statistical tools
After word
Bibliography
Tags: ARS\SNA applicações, ARS\SNA intro, grafos
Century of rock history
Posted by Armando Brito Mendes | Filed under visualização

Para quem gosta de música esta visualização é extraordinária
Jessica Edmondson visualized the history of rock music, from foundations in the pre-1900s to a boom in the 1960s and finally to what we have now. Nodes represent music styles, and edges represent musical connections. There are a lot of them and as a whole it’s a screen of spaghetti, but it’s animated, which is key. It starts at the beginning and develops over time, so you know where to go and what to look at. Music samples for each genre is also a nice touch. [Thanks, Jessica]
Tags: ARS\SNA applicações, ARS\SNA intro, belo, captura de conhecimento, grafos
Using Metadata to Find Paul Revere
Posted by Armando Brito Mendes | Filed under ARS - SNA, visualização
Um exemplo de um estudo de redes sociais
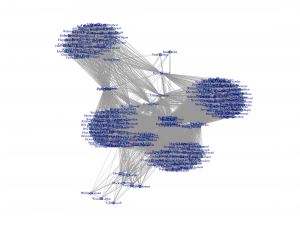
It’s just metadata. What can you do with that? Kieran Healy, a sociology professor at Duke University, shows what you can do, with just some basic social network analysis. Using metadata from Paul Revere’s Ride on the groups that people belonged to, Healy sniffs out Paul Revere as a main target. Bonus points for writing the summary from the point of a view of an 18th century analyst.
What a nice picture! The analytical engine has arranged everyone neatly, picking out clusters of individuals and also showing both peripheral individuals and—more intriguingly—people who seem to bridge various groups in ways that might perhaps be relevant to national security. Look at that person right in the middle there. Zoom in if you wish. He seems to bridge several groups in an unusual (though perhaps not unique) way. His name is Paul Revere.
You can grab the R code and dataset on github, too, if you want to follow along.
Tags: ARS\SNA applicações, ARS\SNA intro, belo, grafos
Introduction to Diagrams
Posted by Armando Brito Mendes | Filed under ARS - SNA, Investigação Operacional, videos, visualização
Uma bela introdução aos grafos
Diagrams are everywhere — from the established conventions of highway signs to the newly emerging visualizations appearing on social networking websites. Most people have a personal experience of diagrams whether drawing directions or figuring out how to operate a new computer. Yet very few people are familiar with how we read or construct diagrams.
This short film introduces the language of diagrams and their role in visual thinking and communication. As only a film can do, it reveals the vocabulary “in the wild” and in the context of making and using diagrams.
Tags: ARS\SNA intro, definição
RSA videos – Manuel Lima
Posted by Armando Brito Mendes | Filed under ARS - SNA, videos

Bom vídeo de divulgação sobre análise de redes sociais (SNA)
Tags: ARS\SNA intro
RSA Animate – The Power of Networks
Posted by Armando Brito Mendes | Filed under ARS - SNA, materiais para profissionais, videos
Excelente video de divulgação sobre análise de redes sociais
Tags: ARS\SNA intro
MindTouch – Wikis and Mashups
Posted by Armando Brito Mendes | Filed under ARS - SNA, software

interface wiki para mashups
Introducing the Social Help System: revolutionary new software that creates product experts and happy customers.
Create loyal user advocates, more profitable customers and lower support costs. MindTouch TCS is a web based authoring and publishing environment that includes a knowledge base, help center, ticketing integration and help button. Your users deserve this.
Tags: ARS\SNA intro, captura de conhecimento
The Siena webpage
Posted by Armando Brito Mendes | Filed under ARS - SNA, software

SIENA is a program for the statistical analysis of network data, with the focus on social networks.
Networks here are understood as entire (complete) networks, not as personal (egocentered) networks: it is assumed that a set of nodes (social actors) is given, and all ties (links) between these nodes are known – except perhaps for a moderate amount of missing data.
SIENA is designed for analyzing various types of data as dependent variables:
- Longitudinal network data:
- This refers to repeated measures of networks on a given node set (although it is allowed that there are some changes in the node set). Models can be specified with actor-oriented as well as tie-oriented dynamics.
- Longitudinal data of networks and behavior:
- This is like longitudinal network data, but in addition there are one or more changing nodal variables that are also treated as dependent variables, and referred to as behavior. The network will influence the dynamics of the behavior, and the behavior will influence the dynamics of the network. In other words, this is about the co-evolution of networks and behavior.
- Cross-sectional network data.
- ‘Cross-sectional’ means that only one observation is available. This method uses exponential random graph models (‘ERGMs’), also called p* models.
The ERG model is implemented in SIENA version 3, but not any more in version 4 (RSiena).
The name SIENA stands for Simulation Investigation for Empirical Network Analysis.
Tags: ARS\SNA intro, R-software
Ruth Ripley’s SNA Page
Posted by Armando Brito Mendes | Filed under ARS - SNA, materiais ensino

I teach two courses on programming in R. Slides etc for the (shared) lectures are here and extra resources for the M.Sc course are here.
My 1998 D.Phil. thesis, Neural Network Models for Breast Cancer Prognosis, is available for downloading in PDF (2.7mb) or 2-up PostScript (680kb).
S-PLUS survival analysis software (similar to that used in the thesis) is available for Unix and Windows. (Previous versions of the software are available for S-PLUS 3.4 and S-PLUS 2000.)
Slides from a seminar entitled Neural network based non-linear survival methods with applications to breast cancer prognosis are available for download as 4-up Postscript (zipped) (75kb)
Software for analysis of western medieval chant melodies, created in collaboration with the Oxchant Group in the Faculty of Music, is available here. A paper describing the work is available here.
A complete list of publications is available here.
Tags: ARS\SNA intro, R-software
Stanford Large Network Dataset Collection
Posted by Armando Brito Mendes | Filed under ARS - SNA, data sets
Bom site com dados para ARS
- Social networks: online social networks, edges represent interactions between people
- Communication networks: email communication networks with edges representing communication
- Citation networks: nodes represent papers, edges represent citations
- Collaboration networks: nodes represent scientists, edges represent collaborations (co-authoring a paper)
- Web graphs: nodes represent webpages and edges are hyperlinks
- Amazon networks : nodes represent products and edges link commonly co-purchased products
- Internet networks : nodes represent computers and edges communication
- Road networks : nodes represent intersections and edges roads connecting the intersections
- Autonomous systems : graphs of the internet
- Signed networks : networks with positive and negative edges (friend/foe, trust/distrust)
- Wikipedia networks and metadata : Talk, editing and voting data from Wikipedia
- Twitter and Memetracker : Memetracker phrases, links and 467 million Tweets
Tags: análise de dados, ARS\SNA intro, grafos