Lostalgic – visualização
Posted by Armando Brito Mendes | Filed under visualização

Forma inovadora de visualizar uma série
This project is based on the entire ABC’s LOST TV show scripts, 115 episodes in 7 seasons, that I managed to parse from Lostpedia. I also parsed this page with additional information about hidden characters relations.
My aim for this project is not (only) to visualize some properties and patterns out of the script but actually to allow to read and enjoy the series in a different way.
I plan to add new views (will inform through twitter), more aimed to reveal global patterns in the script, and I will include cliffhangers and writing teams information.
Find more information about Lostalgic in this great article and interview by Greg J. Smith in Creative Applications.
This project is dedicated to the Lost writers, to the open culture and, in particular, to the community that built Lostpedia.
Modelos de dados
Posted by Armando Brito Mendes | Filed under estatística, Investigação Operacional, matemática, materiais ensino, videos
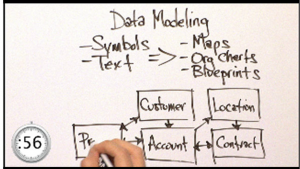
Tackling tough tech in a minute or less. This episode explores Data Modeling with Steve Hoberman, Data Modeling expert, author and educator.
Tags: análise de dados, data mining, otimização
Esri Maps for Office
Posted by Armando Brito Mendes | Filed under software, visualização
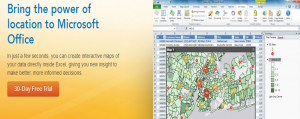
Map-Enable Your Data
Making a map of your Excel data is as easy as creating a graph or chart. Learn more.
Impact Your Audience
Add interactive maps to your PowerPoint presentations. Learn more.
Share Maps in One Click
Quickly share your maps on the web and with mobile apps. Learn more.
Tags: análise de dados, Excel, SIG
Project Management Body of Knowledge
Posted by Armando Brito Mendes | Filed under Investigação Operacional, materiais para profissionais, planeamento

Metodologia de gestão de projetos e norma ISO 21500
O Project Management Body of Knowledge, também conhecido como PMBOK é um conjunto de práticas em gestão de projectos publicado pelo Project Management Institute e constitui a base do conhecimento em gerenciamento de projetos do PMI. Estas práticas são compiladas na forma de um guia, chamado de o Guia PMBOK.
Tags: gestão de projetos, qualidade
TileMill – SIGs para webdesign
Posted by Armando Brito Mendes | Filed under visualização

Excelente software para criar mapas interativos (com dados)
Make beautiful interactive maps
Whether you’re a journalist, web designer, researcher, or seasoned cartographer, TileMill is the design studio you need to create stunning interactive maps.
Tags: SIG
Rede Hidrometeorológica dos Açores
Posted by Armando Brito Mendes | Filed under data sets, estatística, visualização

Excelente site com dados hidrometereológicos
SNA Phone-hacking scandal
Posted by Armando Brito Mendes | Filed under ARS - SNA, visualização
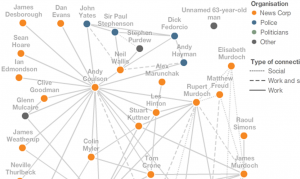
The web of connections on the right shows the key people involved in the phone-hacking story and how their professional and social lives are linked.
Read how the story developed by clicking on the arrows above. As each person’s professional and personal connections are revealed, the web builds up into a complex network of relationships.
Tags: ARS\SNA applicações, text mining
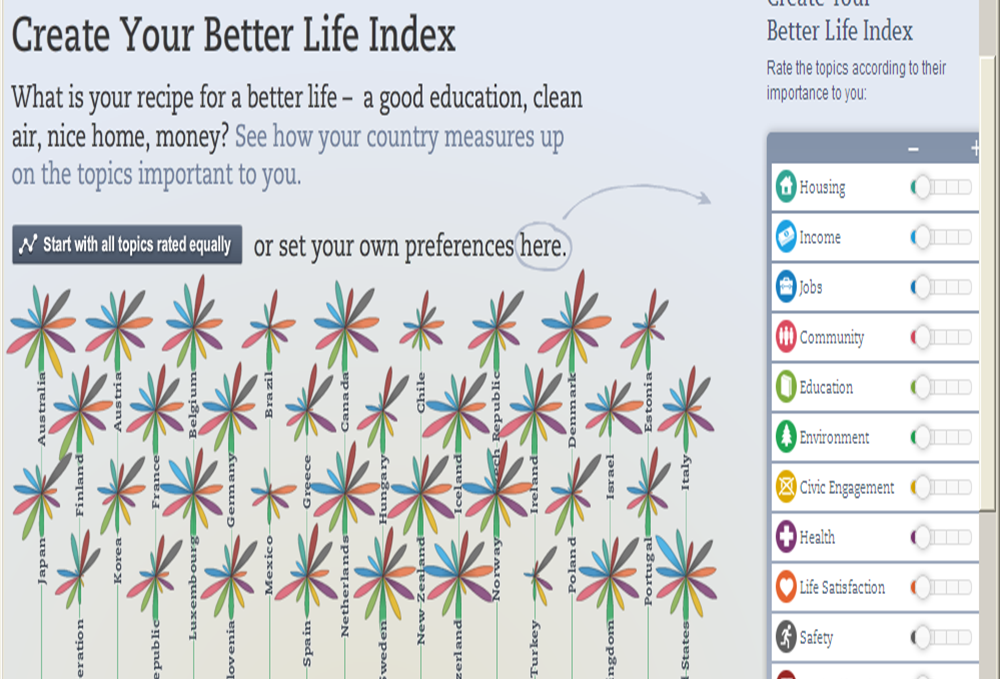
Better Life Index
Posted by Armando Brito Mendes | Filed under ADM - multicritério, Investigação Operacional, software
RSA videos – Manuel Lima
Posted by Armando Brito Mendes | Filed under ARS - SNA, videos

Bom vídeo de divulgação sobre análise de redes sociais (SNA)
Tags: ARS\SNA intro
RSA Animate – The Power of Networks
Posted by Armando Brito Mendes | Filed under ARS - SNA, materiais para profissionais, videos
Excelente video de divulgação sobre análise de redes sociais
Tags: ARS\SNA intro