SPSS Web Book Regression with SPSS
Posted by Armando Brito Mendes | Filed under estatística, materiais ensino, software

Bom livro sobre regressão linear com SPSS
by Xiao Chen, Phil Ender, Michael Mitchell and Christine Wells (in alphabetical order) The aim of these materials is to help you increase your skills in using regression analysis with SPSS. This web book does not teach regression, per se, but focuses on how to perform regression analyses using SPSS. It is assumed that you have had at least a one quarter/semester course in regression (linear models) or a general statistical methods course that covers simple and multiple regression and have access to a regression textbook that explains the theoretical background of the materials covered in these chapters.
Tags: análise de dados, data mining, IBM SPSS Statistics, inferência, previsão, software estatístico
Data Analysis Examples
Posted by Armando Brito Mendes | Filed under estatística, software
Bons exemplos de análises complexas com vários softwares
The pages below contain examples (often hypothetical) illustrating the application of different statistical analysis techniques using different statistical packages. Each page provides a handful of examples of when the analysis might be used along with sample data, an example analysis and an explanation of the output, followed by references for more information. These pages merely introduce the essence of the technique and do not provide a comprehensive description of how to use it.
Tags: captura de conhecimento, data mining, decisão médica, IBM SPSS Statistics, inferência, inquéritos, R-software, software estatístico
SPSS Starter Kit
Posted by Armando Brito Mendes | Filed under estatística, software
Lições sobre utilização introdutória ao SPSS
SPSS Annotated Output
SPSS Class Notes
SPSS Learning Modules
SPSS Frequently Asked Questions
SPSS Library
SPSS Code Fragments
Tags: análise de dados, Estat Descritiva, IBM SPSS Statistics, inferência, inquéritos, software estatístico
SPSS On-Line Training Workshop
Posted by Armando Brito Mendes | Filed under estatística, software, videos

Muitos e bons videos de utilização das versões mais recentes do SPSS
Tutorials and Clips
![]() Overview of SPSS
Overview of SPSS
![]() Getting Started
Getting Started
![]() Options in the Edit Menu
Options in the Edit Menu
![]() Open Files in SPSS
Open Files in SPSS
![]() Define/Modify Variables
Define/Modify Variables
![]() File Manipulation: sort, merge, Transpose
File Manipulation: sort, merge, Transpose
![]() File Manipulation: select, split
File Manipulation: select, split
![]() Programmability Extension-Using R inside SPSS , …
Programmability Extension-Using R inside SPSS , …
Tags: IBM SPSS Statistics, software estatístico
Raynald’s SPSS tools
Posted by Armando Brito Mendes | Filed under estatística, software
Páginas pessoais com muita info. sobre SPSS
Desde Dezembro de 1998 que tenho participado no grupo de discussão SPSSX-L e no newsgroup comp.soft-sys.stat.spss. Estas participações aumentaram o meu grau de conhecimento acerca SPSS em cerca de 25. Tenho aprendido muito com muitos utilizadores do SPSS, tais como:
John Hendrickx, Hector E. Maletta, Rolf Kjoeller, David Marso e Neila Nessa.
Pelo meu lado, respondi a cerca de 2100 questões colocadas nestes dois grupos de discussão. É mais divertido aprender o SPSS através da resposta a questões reais, do que a ler livros e a “inventar problemas” para resolver. Acho que a diversidade de problemas e situações com que nos deparamos nestes grupos fascinantes. (E isto, provavelmente, diz muita coisa acerca da minha personalidade ![]() ).
).
Para uma visão geral da minha página, queiram consultar o mapa do site.
Frequently Asked Question (FAQ)
SPSS Tips
Newbie’s Corner
Sample SPSS Syntax
Learning SPSS Syntax
Debugging Syntax
Sample Macros
Macro Tutorials
Debugging Macros
Sample Scripts
Learning Scripts
Python
Tags: desnvolvimento de software, IBM SPSS Statistics, inquéritos, software estatístico
SPSS Programming and Data Management book
Posted by Armando Brito Mendes | Filed under estatística, software
Manual grátis do IBM-SPSS
SPSS Programming and Data Management:
A Guide for SPSS and SAS Users
The first edition of the book was released by SPSS on January 7th, 2004. Here is the description found on SPSS’s site:
SPSS is pleased to announce the availability of “SPSS Programming and Data Management: A Guide for SPSS and SAS Users” written by SPSSX list member, Raynald Levesque, already well known for his practical solutions to complex SPSS programming problems.
The book reveals the wealth of functionality beneath the SPSS graphical user interface, with detailed examples of command syntax, the macro facility, scripting, and the new Output Management System. Until now, no other book has focused on these features, and many users have been unaware of the data management power and flexibility available in SPSS. The book also contains a chapter for users familiar with SAS, demonstrating how many common data management tasks are performed in both SAS and SPSS.
Although the first 5 editions (for SPSS 12 to SPSS 16) were available in hard copy, this is no longer the case. Only pdf versions are available for SPSS 17 and newer.
Tags: análise de dados, IBM SPSS Statistics, inferência, software estatístico
IBM SPSS product portfolio
Posted by Armando Brito Mendes | Filed under estatística, software
Página da IBM dedicada ao SPSS e co.
Why SPSS software?
With SPSS predictive analytics software, you can predict with confidence what will happen next so that you can make smarter decisions, solve problems and improve outcomes.
Tags: análise de dados, Estat Descritiva, IBM SPSS Statistics, inferência, previsão, software estatístico
How long will we live — and how well?
Posted by Armando Brito Mendes | Filed under estatística, visualização
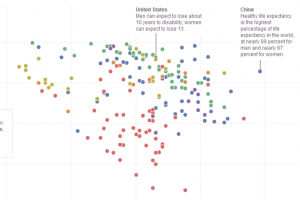
Gráfico animado de dispersão entre a esperança média de vida e a % de anos com saude
Circule entre os dois anos com informação para ver a animação.
For every year increase in life expectancy worldwide, healthy life expectancy increased about 9-1/2 months.
Tags: análise de dados, gestão de projetos
OrgOrgChart: The Evolution of an Organization
Posted by Armando Brito Mendes | Filed under planeamento, videos, visualização
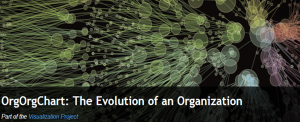
As empresas são organismos vivos: animação do organigrama de uma grande empresa
The OrgOrgChart (Organic Organization Chart) project looks at the evolution of a company’s structure over time. A snapshot of the Autodesk organizational hierarchy was taken each day between May 2007 and June 2011, a span of 1498 days.
Each day the entire hierarchy of the company is constructed as a tree with each employee represented by a circle, and a line connecting each employee with his or her manager. Larger circles represent managers with more employees working under them. The tree is then laid out using a force-directed layout algorithm.
Each second in the animation is about one week of activity, and acquisitions are most obvious when big clumps of people join the company. The long-term changes are a little harder to see, because the branches in the network fade into the background. Recomputing the layout each week might be good for the next round.
Tags: modelos empresariais
Atlas of Science
Posted by Armando Brito Mendes | Filed under ARS - SNA, visualização
Um atlas com mapas muito belos e informativos
Introduction
Overview, promotion, and how to order.
Images
Access references and download high resolution images
References
Search all references and download in fielded format
Author
About the author
History
History of the Atlas
Awards
Awards for Atlas of Science
Questions & Answers
You ask, the author answers.
Vendors & Events
Where to buy
Libraries
Where to borrow
Press
What others have been saying