Fontes de dados do FlowingData
Posted by Armando Brito Mendes | Filed under data sets, estatística
Uma lista de fontes de dados da FlowingData
I gathered some resources a few years ago on where to find data. Some of the sites are dead now, but it should give you a good idea of where to get some spreadsheets and CSV files. If you’re lucky, you might find data sources in PDF format. Have fun with that.
Tags: data mining, Estat Descritiva
Dictionary of Numbers
Posted by Armando Brito Mendes | Filed under estatística, matemática, materiais para profissionais

um dicionário q associa factos a números
is an award-winning Google Chrome extension that tries to make sense of numbers you encounter on the web by giving you a description of that number in human terms. Like a dictionary describes words you don’t know in terms you do, Dictionary of Numbers puts quantities you’re unfamiliar with in terms you can understand. Because “8 million people” means nothing, but “population of New York City” means everything.
Tags: belo, Estat Descritiva, problemas
Mapping all the rivers in the United States
Posted by Armando Brito Mendes | Filed under visualização
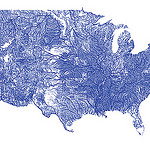
Um mapa de todos os cursos de água dos EUA com o código respetivo
Inspired by Ben Fry’s All Streets map, which showed every road in the United States, Nelson Minar mapped every river to similar effect. As you’d expect, the geography of the United States emerges without actually mapping locations.
We saw a similar map from National Geographic, which showed the rivers of the world and took home an award for best map of 2010 at Malofiej. So Minar’s map isn’t especially new, but the good bit is that Minar posted a tutorial and his code on github, so that you can see how such a map is made.
Most of the actual cartography is being done in Javascript, in the Leaflet and Polymaps drawing scripts. This tutorial code does very little, mostly just drawing blue lines in varying thicknesses. In addition the Leaflet version has a simple popup when rivers are clicked. With the actual vector geometry and metadata available in Javascript a lot more could be done in the presentation; highlighting rivers, interactive filtering by Strahler number, combination with other vector data sources, etc.
WEKA: Remote Experiment
Posted by Armando Brito Mendes | Filed under software

permite computação distribuída usando um servidor com algoritmos WEKA
Remote experiments enable you to distribute the computing load across multiple computers. In the following we will discuss the setup and operation for HSQLDB and MySQL.
Tags: análise de dados, data mining, DW \ BI, WEKA
Survs: Ferramenta para inquéritos on-line
Posted by Armando Brito Mendes | Filed under estatística, software

Boa ferramenta para construção de inquéritos on-line
Create online surveys with your team easily and efficiently.
Survs is a web-based tool to create, distribute, and analyze online surveys. Its friendly interface and compelling features provide everything you need to get feedback.
Tags: inquéritos, software estatístico
List of R Resources
Posted by Armando Brito Mendes | Filed under estatística, materiais para profissionais, software
muito boa lista de recursos sobre R
There is a wealth of resources on the Web and elsewhere to learn more about R. Here are some of the best.
Tags: data mining, Estat Descritiva, R-software, software estatístico
Introduction to R for SAS and SPSS Users
Posted by Armando Brito Mendes | Filed under estatística, materiais para profissionais
algumas comparações e conselhos úteis
R is free software for data analysis and graphics that is similar to SAS and SPSS. Two million people are part of the R Open Source Community. Its use is growing very rapidly and Revolution Analytics distributes a commercial version of R that adds capabilities that are not available in the Open Source version. This 60-minute webinar is for people who are familiar with SAS or SPSS who want to know how R can strengthen their analytics strategy. It will include:
- What R is and how it compares to SAS and SPSS
- An overview of how to install and maintain it
- How to find R add-on modules comparable to those for SAS and SPSS
- Which of R’s many user interfaces are most like those of SAS and SPSS
- How to run R from within SAS and SPSS
- What a simple R program looks like
- Q&A with Bob Muenchen
Repaly the webcast and find out how SAS and SPSS users can take advantage of R.
Tags: data mining, IBM SPSS Statistics, R-software, software estatístico
Using Metadata to Find Paul Revere
Posted by Armando Brito Mendes | Filed under ARS - SNA, visualização

Um exemplo de um estudo de redes sociais
It’s just metadata. What can you do with that? Kieran Healy, a sociology professor at Duke University, shows what you can do, with just some basic social network analysis. Using metadata from Paul Revere’s Ride on the groups that people belonged to, Healy sniffs out Paul Revere as a main target. Bonus points for writing the summary from the point of a view of an 18th century analyst.
What a nice picture! The analytical engine has arranged everyone neatly, picking out clusters of individuals and also showing both peripheral individuals and—more intriguingly—people who seem to bridge various groups in ways that might perhaps be relevant to national security. Look at that person right in the middle there. Zoom in if you wish. He seems to bridge several groups in an unusual (though perhaps not unique) way. His name is Paul Revere.
You can grab the R code and dataset on github, too, if you want to follow along.
Tags: ARS\SNA applicações, ARS\SNA intro, belo, grafos
Stupid Calculations
Posted by Armando Brito Mendes | Filed under matemática, visualização

Porque os cálculos tb podem ser divertidos
Josh Orter takes back-of-the-napkin math to the next level with Stupid Calculations, which promises to turn practical facts into utterly useless ones. Stupid calculation number one is the size of a giant iPhone screen if you combined all the iPhone screens ever sold into one.
The eye-glazing calculations are laid out below for those who appreciate the dirty work but, skipping ahead, the Kubrick-inspired monophone would stretch 5,059 feet into the sky and have a base measuring 2,846 feet across (Central Park is 2,640 feet wide). Its surface area would take in 2.07 billion square inches. That’s 14.39 million square feet or 330.54 acres. The new World Trade Center, by comparison, will have a surface area of 23 glass-clad acres, giving us enough screenage to watch Game of Thrones on all four sides of fourteen WTCs.
See also how long it would it take to drink the water in an olympic-sized pool through a straw.
Tags: belo, Estat Descritiva
Map Blog Dashboard
Posted by Armando Brito Mendes | Filed under videos, visualização

Um dashboard com os videos mais vistos por região (apenas EUA)
Videos uploaded within 48 hours may not yet appear in age and gender breakdowns.
Tags: belo