Cognitive Mapping: Definitions, Examples, and Resources
Posted by Armando Brito Mendes | Filed under Investigação Operacional, visualização

Cognitive Mapping Definitions, Examples, and Resources
- Definition of Cognitive Mapping
- History and Use of the Term
 Examples of cognitive maps
 - The Process of Cognitive Mapping
- Different Types of Cognitive Map
and Mapping Techniques
Causal mapping - Definition of a Concept Map
Examples of concept maps - Theory and Use of Concept Maps
- The Medicine Wheel as a Concept Map
- Semantic Mapping
Examples of semantic maps - Semantic Web
- Visual Schemata
- Wayfinding — Which Way Is Up?
- Intrapsychic cognitive maps
- History and Use of the Term
- Left Sidebar
- Right Sidebar —
References & Resources
Tags: captura de conhecimento, data mining, grafos, mapas
Mapas cognitivos – How to Map
Posted by Armando Brito Mendes | Filed under Investigação Operacional, visualização

mapas cognitivivos
Cognitive Mapping is a technique which has been developed over a period of time and through its application has demonstrated its use for Operational Researchers working on a variety of different tasks.
Tags: captura de conhecimento, data mining, grafos, mapas
MapWindow GIS Open Source
Posted by Armando Brito Mendes | Filed under visualização

mapWindow openSource software
MapWindow GIS desktop application is a free, open source, standards-based standalone software package that you can use to view and edit GIS data in many file formats.
Está longe de ter as funcionalidade do ArcGIS mas tem a grande vantagem de ser de código aberto.
Problems with Gantt Charts
Posted by Armando Brito Mendes | Filed under Investigação Operacional, planeamento, visualização

Project Management Graphics (or Gantt Charts), by Edward Tufte
Computer screens are generally too small for an overview of big serious projects. Horizontal and vertical scrolling are necessary to see more than about 40 horizontal time lines for a reasonable period of time. Thus, for large projects, print out the sequence on a big roll of paper and put it up on a wall.
Tags: gestão de projetos
Criar gráficos de Gantt no Excel
Posted by Armando Brito Mendes | Filed under Investigação Operacional, materiais ensino, visualização
rrphillips | 14 de junho de 2007 | 688 pessoa(s) gosta(m), 18 pessoa(s) não gosta(m)
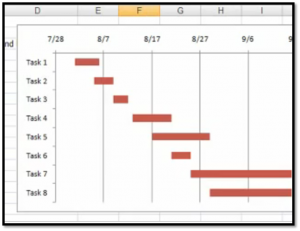
Using Excel 2007 to create a Gantt chart–a popular project management tool
Categoria: Guias e Estilo
- Demonstra como criar um gráfico de Gantt no Excel
- Demonstra como criar um gráfico de Gantt no Excel
Tags: Excel, programação em folha de cálculo
As redes podem explodir
Posted by Armando Brito Mendes | Filed under ARS - SNA, visualização
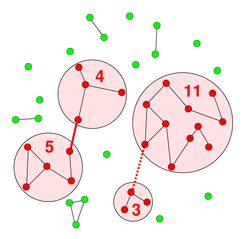
Scientists from the Max Planck Institute for Dynamics and Self-Organization discover how the size of networks can skyrocket
A single new connection can dramatically enhance the size of a network – no matter whether this connection represents an additional link in the Internet, a new acquaintance within a circle of friends or a connection between two nerve cells in the brain.
novas ligações fazem explodir a dimensão das redes
Tags: ARS\SNA intro
NodeXL: Suplemento do Excel openSource para SNA
Posted by Armando Brito Mendes | Filed under ARS - SNA, visualização
Add-in do Excel para Análise de Redes Sociais (SNA)
Do you need to display and analyze a network graph but you don’t want to deal with difficult applications, arcane file formats, or advanced programming languages? NodeXL may be what you’re looking for.
Tags: ARS\SNA intro, grafos
Poder da visualização: Iluminação nocturna
Posted by Armando Brito Mendes | Filed under visualização

imagens de satélite
Explore Earth images at night. Use our online satellite images to zoom in on your hometown or view places far away. Compare satellite images from 1993, 1997 and 2003 to infer changes in population, energy consumption, energy efficiency and economic activity. Read more about energy issues at Energy Resources from the National Academies. What patterns of human activity can you find?
Representação do faceBook em grafo
Posted by Armando Brito Mendes | Filed under visualização
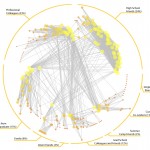
imagem do faceBook em grafo
Um exemplo do tipo de visualização possíveis com grafos.
Esta representação mostra a relação de “amizade” entre indivíduos com páginas no faceBook em resultado de respostas a um inquérito.
Tags: ARS\SNA intro, facebook