Ternary Diagrams Using R
Posted by Armando Brito Mendes | Filed under estatística, materiais ensino, visualização
clique na imagem para seguir o link
Exemplo de criação de diagramas ternários no R
Ternary Diagrams Using R: An Example Using Election Outcomes
A tutorial by D. M. Wiig
In part one of this tutorial I discussed creating a ternary diagram using a simple data frame that contained five hypothetical cases. In this tutorial I will expand on that foundation by creating a more informative ternary diagram using live data.
A useful application of this package in social science research is creating a visual display of parliamentary election outcomes. Specifically we can use a ternary graph to examine the distribution of seats in the British House of Commons over a period of time. Since the UK uses a proportional system to allocate seats in the House of Commons there can be a variety of outcomes in any given national election.
Tags: Estat Descritiva, R-software
Science Isn’t Broken
Posted by Armando Brito Mendes | Filed under estatística, materiais para profissionais, visualização

clique na imagem para seguir o link
Um bom blog com discussões interessantes e ilustrações muito boas
The Scientific Method 7:00 AM Aug 19, 2015
Science Isn’t Broken
It’s just a hell of a lot harder than we give it credit for.
Graphics by Ritchie King
If you follow the headlines, your confidence in science may have taken a hit lately.
Peer review? More like self-review. An investigation in November uncovered a scam in which researchers were rubber-stamping their own work, circumventing peer review at five high-profile publishers.
Hack Your Way To Scientific Glory
Tags: belo, inferência
Statistical Atlas
Posted by Armando Brito Mendes | Filed under estatística, mapas SIG's, materiais ensino, visualização
clicar na imagem para seguir o link
Um projeto em curso que pretende criar mapas temáticos de todos os dados existentes nos EUA, ambicioso, não?
Age and Sex
This is the age and biological sex of the population.
Disability
This is disability status.
Education
This is who goes to school.
Geology
This is the land and water.
Government
This is how the government functions.
Income and Earnings
This is how much money people make.
Language
This is how people communicate.
Living Arrangement
This is the household makeup.
Mortality
This is how people die.
Origins
This is where people come from.
Population
This is how many people there are.
Poverty
This is who lives below the poverty thresholds.
Transportation
This is how people get around.
Work
This is where and how people work.
Tags: belo, Estat Descritiva, mapas, R-software
KNIME Image Processing (trusted extension)
Posted by Armando Brito Mendes | Filed under videos, visualização
clicar na imagem para seguir o link
Apenas um exemplo das fantásticas possibilidades do KNIME
KNIME Image Processing (trusted extension)
Fri, 12/03/2010 – 13:09 — knime_admin
Overview
The KNIME Image Processing Plugin allows you to read in more than 120 different kinds of images (thanks to the Bio-Formats API) and to apply well known methods on images, like preprocessing. segmentation, feature extraction, tracking and classification in KNIME. In general these nodes operate on multi-dimensional image data (e.g. videos, 3D images, multi-channel images or even a combination of them), which is made possible by the internally used ImgLib2-API.
Several nodes are available to calculate image features (e.g. zernike-, texture- or histogram features) for segmented images (e.g. a single cell). These feature vectors can then be used to apply machine learning methods in order to train and apply a classifier.
Currently the Image Processing Plugin for KNIME provides ca. 100 nodes for (pre)-processing, filtering, segmentation, feature extraction, various views (2D, 3D), etc. and integrations for various other image processing tools are available (see used and integrated libraries)
 Future directions include a full, bidirectional integration of ImageJ2. Such an integration allow the users to use directly use/update ImageJ2 Plugins inside KNIME as well as recording and running KNIME Workflows in ImageJ2. Please see ImageJ2 Integration (BETA) for more information.
For the first steps please consider the KNIME Image Processing User Manual (incomplete draft!).
Important Links
- How to install KNIME Image Processing?
- Example Workflows and Tutorials
- KNIME Image Processing Forum
- KNIME Image Processing (Webinar on YouTube)
- KNIME FAQ
- KNIME Image Processing on GitHub
- KNIME Image Processing News
- Contact
Tags: data mining, image mining, Knime
Real Chart Rules to Follow
Posted by Armando Brito Mendes | Filed under estatística, materiais ensino, visualização
clicar na imagem para seguir o link
Excelente guia sobre construção de gráficos para representar dados.
There are a lot of “rules” for visualization. Some are actual rules, and some are suggestions to help you make choices. Many of the former can be broken, if that’s what the data dictates and you know what you’re doing.
But, there are rules—usually for specific chart types meant to be read in a specific way and with few exceptions—that you shouldn’t break. When they are, everyone loses. This is that small handful.
Tags: data mining, definição, Estat Descritiva, R-software
Ternary Diagrams Using R
Posted by Armando Brito Mendes | Filed under visualização
clique na imagem para seguir o link
Ensina a construir um diagrama ternário no R
Ternary Diagrams Using R: The ggtern Package
A tutorial by Douglas M. Wiig
There are a number of very useful and popular graphics packages available for R such as lattice, ggplot, ggplot2 and others. Some of these offer general purpose graphics capabilities and others are more specialized. A recently developed extension to the ggplot2 package is ggtern. This package is essentially a wrapper for a number of functions that can be used to create a variety of ternary diagrams. Ternary diagrams are useful when analyzing the relationship among three factors or elements. A ternary diagram essentially represents the proportions of three related factors in two-dimensional space.
Tags: análise de dados, R-software
Comprehensive Guide to Data Visualization in R
Posted by Armando Brito Mendes | Filed under estatística, visualização
clique na imagem para seguir o link
Bom resumo de alguns tipos de gráficos que podem ser obtidos no R, do mais simples a alguns mais complexos.
This visualization (originally created using Tableau) is a great example of how data visualization can help decision makers. Imagine telling this information to an investor through a table. How long do you think you will take to explain it to him?
With ever increasing volume of data in today’s world, it is impossible to tell stories without these visualizations. While there are dedicated tools like Tableau, QlikView and d3.js, nothing can replace a modeling / statistics tools with good visualization capability. It helps tremendously in doing any exploratory data analysis as well as feature engineering. This is where R offers incredible help.
R Programming offers a satisfactory set of inbuilt function and libraries (such as ggplot2, leaflet, lattice) to build visualizations and present data. In this article, I have covered the steps to create the common as well as advanced visualizations in R Programming.
Tags: análise de dados, data mining, Estat Descritiva, R-software, software estatístico
Free Social Media Tools
Posted by Armando Brito Mendes | Filed under materiais para profissionais, visualização
clicar na imagem para seguir o link
Uma imagem do tipo infografic com 19 aplicativos e serviços que podem fornecer informação estatística útil para profissionais de marketing digital ou quem pretende criar um website bem sucedido
Tags: data mining, modelos empresariais
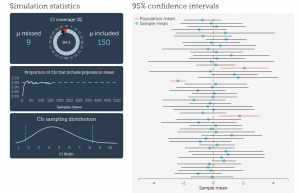
visualização do intervalo de confiança
Posted by Armando Brito Mendes | Filed under estatística, materiais ensino, visualização
clicar na imagem para seguir o link
Boa forma de visualizar o conceito de Intervalo de Confiança Aleatório.
About the visualization
Some say that a shift from hypothesis testing to confidence intervals and estimation will lead to fewer statistical misinterpretations. Personally, I am not sure about that. But I agree with the sentiment that we should stop reducing statistical analysis to binary decision-making. The problem with CIs is that they are as unintuitive and as misunderstood p-values and null hypothesis significance testing. Moreover, CIs are often used to perform hypothesis tests and are therefore prone to the same misuses as p-values.
Tags: belo, definição, inferência
CRAN Task Views
Posted by Armando Brito Mendes | Filed under estatística, visualização

clique na imagem para seguir o link
Uma lista de temas com uma descrição dos principais pacotes R ligados ao tema
CRAN Task Views
| Bayesian | Bayesian Inference |
| ChemPhys | Chemometrics and Computational Physics |
| ClinicalTrials | Clinical Trial Design, Monitoring, and Analysis |
| Cluster | Cluster Analysis & Finite Mixture Models |
| DifferentialEquations | Differential Equations |
| Distributions | Probability Distributions |
| Econometrics | Econometrics |
| Environmetrics | Analysis of Ecological and Environmental Data |
| ExperimentalDesign | Design of Experiments (DoE) & Analysis of Experimental Data |
| Finance | Empirical Finance |
| Genetics | Statistical Genetics |
| Graphics | Graphic Displays & Dynamic Graphics & Graphic Devices & Visualization |
| HighPerformanceComputing | High-Performance and Parallel Computing with R |
| MachineLearning | Machine Learning & Statistical Learning |
| MedicalImaging | Medical Image Analysis |
| MetaAnalysis | Meta-Analysis |
| Multivariate | Multivariate Statistics |
| NaturalLanguageProcessing | Natural Language Processing |
| NumericalMathematics | Numerical Mathematics |
| OfficialStatistics | Official Statistics & Survey Methodology |
| Optimization | Optimization and Mathematical Programming |
| Pharmacokinetics | Analysis of Pharmacokinetic Data |
| Phylogenetics | Phylogenetics, Especially Comparative Methods |
| Psychometrics | Psychometric Models and Methods |
| ReproducibleResearch | Reproducible Research |
| Robust | Robust Statistical Methods |
| SocialSciences | Statistics for the Social Sciences |
| Spatial | Analysis of Spatial Data |
| SpatioTemporal | Handling and Analyzing Spatio-Temporal Data |
| Survival | Survival Analysis |
| TimeSeries | Time Series Analysis |
| WebTechnologies | Web Technologies and Services |
| gR | gRaphical Models in R |
To automatically install these views, the ctv package needs to be installed, e.g., via
install.packages("ctv")
library("ctv")
and then the views can be installed via install.views or update.views (which first assesses which of the packages are already installed and up-to-date), e.g.,
install.views("Econometrics")
or
update.views("Econometrics")