Introduction to social network methods
Posted by Armando Brito Mendes | Filed under ARS - SNA, materiais ensino
Robert A. Hanneman and Mark Riddle
Introduction to social network methods
Table of contents
About this book
This on-line textbook introduces many of the basics of formal approaches to the analysis of social networks. The text relies heavily on the work of Freeman, Borgatti, and Everett (the authors of the UCINET software package). The materials here, and their organization, were also very strongly influenced by the text of Wasserman and Faust, and by a graduate seminar conducted by Professor Phillip Bonacich at UCLA. Many other users have also made very helpful comments and suggestions based on the first version. Errors and omissions, of course, are the responsibility of the authors.
You are invited to use and redistribute this text freely — but please acknowledge the source.
Hanneman, Robert A. and Mark Riddle. 2005. Introduction to social network methods. Riverside, CA: University of California, Riverside ( published in digital form athttp://faculty.ucr.edu/~hanneman/ )
Table of contents:
Preface
1. Social network data
2. Why formal methods?
3. Using graphs to represent social relations
4. Working with Netdraw to visualize graphs
5. Using matrices to represent social relations
6. Working with network data
7. Connection
8. Embedding
9. Ego networks
10. Centrality and power
11. Cliques and sub-groups
12. Positions and roles: The idea of equivalence
13. Measures of similarity and structural equivalence
14. Automorphic equivalence
15. Regular equivalence
16. Multiplex networks
17. Two-mode networks
18. Some statistical tools
After word
Bibliography
Tags: ARS\SNA applicações, ARS\SNA intro, grafos
Using Metadata to Find Paul Revere
Posted by Armando Brito Mendes | Filed under ARS - SNA, visualização
It’s just metadata. What can you do with that? Kieran Healy, a sociology professor at Duke University, shows what you can do, with just some basic social network analysis. Using metadata from Paul Revere’s Ride on the groups that people belonged to, Healy sniffs out Paul Revere as a main target. Bonus points for writing the summary from the point of a view of an 18th century analyst.
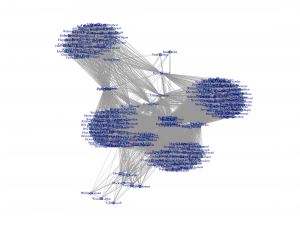
What a nice picture! The analytical engine has arranged everyone neatly, picking out clusters of individuals and also showing both peripheral individuals and—more intriguingly—people who seem to bridge various groups in ways that might perhaps be relevant to national security. Look at that person right in the middle there. Zoom in if you wish. He seems to bridge several groups in an unusual (though perhaps not unique) way. His name is Paul Revere.
You can grab the R code and dataset on github, too, if you want to follow along.
Tags: ARS\SNA applicações, ARS\SNA intro, belo, grafos
How to: network animation with R and the iGraph
Posted by Armando Brito Mendes | Filed under ARS - SNA, software
This article lists the steps I take to create a network animation in R, provides some example source code that you can copy and modify for your own work, and starts a discussion about programming and visualization as an interpretive approach in research. Before I start, take a look at this network animation created with R and the iGraph package. This animation is of a retweet network related to #BankTransferDay. Links (displayed as lines) are retweets, nodes (displayed as points) are user accounts. For each designated period of time (in this case, an hour), retweets are drawn and then fade out over 24 hours.
Tags: captura de conhecimento, data mining, grafos, R-software
Atlas of Science
Posted by Armando Brito Mendes | Filed under ARS - SNA, visualização
Introduction
Overview, promotion, and how to order.
Images
Access references and download high resolution images
References
Search all references and download in fielded format
Author
About the author
History
History of the Atlas
Awards
Awards for Atlas of Science
Questions & Answers
You ask, the author answers.
Vendors & Events
Where to buy
Libraries
Where to borrow
Press
What others have been saying
Introduction to Diagrams
Posted by Armando Brito Mendes | Filed under ARS - SNA, Investigação Operacional, videos, visualização
Diagrams are everywhere — from the established conventions of highway signs to the newly emerging visualizations appearing on social networking websites. Most people have a personal experience of diagrams whether drawing directions or figuring out how to operate a new computer. Yet very few people are familiar with how we read or construct diagrams.
This short film introduces the language of diagrams and their role in visual thinking and communication. As only a film can do, it reveals the vocabulary “in the wild” and in the context of making and using diagrams.
Tags: ARS\SNA intro, definição
Projeto portugues de análise de text mining
Posted by Armando Brito Mendes | Filed under ARS - SNA
redes de relações entre entidades: O Mundo Visto Daqui
Nuvem de palavras mais frequentes: Bubble Cloud
Tags: ARS\SNA applicações, data mining, facebook, text mining
SNA Phone-hacking scandal
Posted by Armando Brito Mendes | Filed under ARS - SNA, visualização
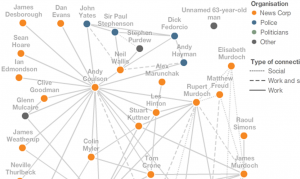
The web of connections on the right shows the key people involved in the phone-hacking story and how their professional and social lives are linked.
Read how the story developed by clicking on the arrows above. As each person’s professional and personal connections are revealed, the web builds up into a complex network of relationships.
Tags: ARS\SNA applicações, text mining
RSA videos – Manuel Lima
Posted by Armando Brito Mendes | Filed under ARS - SNA, videos
Tags: ARS\SNA intro
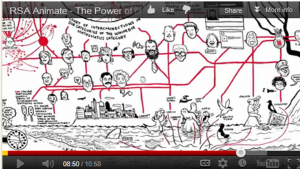
RSA Animate – The Power of Networks
Posted by Armando Brito Mendes | Filed under ARS - SNA, materiais para profissionais, videos
Tags: ARS\SNA intro
MindTouch – Wikis and Mashups
Posted by Armando Brito Mendes | Filed under ARS - SNA, software
Introducing the Social Help System: revolutionary new software that creates product experts and happy customers.
Create loyal user advocates, more profitable customers and lower support costs. MindTouch TCS is a web based authoring and publishing environment that includes a knowledge base, help center, ticketing integration and help button. Your users deserve this.
