Introduction to R for SAS and SPSS Users
Posted by Armando Brito Mendes | Filed under estatística, materiais para profissionais
algumas comparações e conselhos úteis
R is free software for data analysis and graphics that is similar to SAS and SPSS. Two million people are part of the R Open Source Community. Its use is growing very rapidly and Revolution Analytics distributes a commercial version of R that adds capabilities that are not available in the Open Source version. This 60-minute webinar is for people who are familiar with SAS or SPSS who want to know how R can strengthen their analytics strategy. It will include:
- What R is and how it compares to SAS and SPSS
- An overview of how to install and maintain it
- How to find R add-on modules comparable to those for SAS and SPSS
- Which of R’s many user interfaces are most like those of SAS and SPSS
- How to run R from within SAS and SPSS
- What a simple R program looks like
- Q&A with Bob Muenchen
Repaly the webcast and find out how SAS and SPSS users can take advantage of R.
Tags: data mining, IBM SPSS Statistics, R-software, software estatístico
LIBSVM — A Library for Support Vector Machines
Posted by Armando Brito Mendes | Filed under software
Página dos autores da biblioteca LIBSVM, a mais usada para SVM
LIBSVM — A Library for Support Vector Machines
Chih-Chung Chang and Chih-Jen Lin
 Version 3.17 released on April Fools’ day, 2013. We slightly adjust the way class labels are handled internally. By default labels are ordered by their first occurrence in the training set. Hence for a set with -1/+1 labels, if -1 appears first, then internally -1 becomes +1. This has caused confusion. Now for data with -1/+1 labels, we specifically ensure that internally the binary SVM has positive data corresponding to the +1 instances. For developers, see changes in the subrouting svm_group_classes of svm.cpp.
We now have a nice page LIBSVM data sets providing problems in LIBSVM format.
A practical guide to SVM classification is available now! (mainly written for beginners)
LIBSVM tools available now!
We now have an easy script (easy.py) for users who know NOTHING about svm. It makes everything automatic–from data scaling to parameter selection.
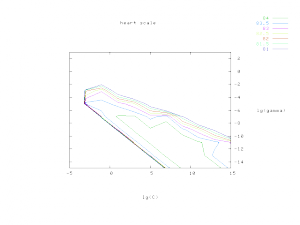
The parameter selection tool grid.py generates the following contour of cross-validation accuracy. To use this tool, you also need to install python and gnuplot.
Tags: captura de conhecimento, data mining, otimização, R-software, RapidMiner, WEKA
FlowingData Tutorials
Posted by Armando Brito Mendes | Filed under estatística, visualização
Excelentes tutoriais sobre visualizações de dados.
How to Animate Transitions Between Multiple Charts
Getting Started with Charts in R
How to Make an Interactive Choropleth Map ☆
More on Making Heat Maps in R ☆
Mapping with Diffusion-based Cartograms ☆
How to Make an Interactive Network Visualization
A Variety of Area Charts with R ☆
How to Draw in R and Make Custom Plots ☆
How to Visualize and Compare Distributions
How to Make a Sankey Diagram to Show Flow ☆
Interactive Time Series Chart with Filters ☆
Calendar Heatmaps to Visualize Time Series Data ☆
How to Hand Edit R Plots in Inkscape ☆
How to Make a Contour Map ☆
Using Color Scales and Palettes in R ☆
Build Interactive Time Series Charts with Filters ☆
How to map connections with great circles
How to Make Bubble Charts
How to visualize data with cartoonish faces ala Chernoff
How to: make a scatterplot with a smooth fitted line
An Easy Way to Make a Treemap
How to Make a Heatmap – a Quick and Easy Solution
How to Make an Interactive Area Graph with Flare
How to Make a US County Thematic Map Using Free Tools
How to Make a Graph in Adobe Illustrator
How to Make Your Own Twitter Bot – Python Implementation
Grabbing Weather Underground Data with BeautifulSoup
Tags: análise de dados, captura de conhecimento, data mining, desnvolvimento de software, Estat Descritiva, R-software
How to: network animation with R and the iGraph
Posted by Armando Brito Mendes | Filed under ARS - SNA, software

Construir animações de informação relacional com R
This article lists the steps I take to create a network animation in R, provides some example source code that you can copy and modify for your own work, and starts a discussion about programming and visualization as an interpretive approach in research. Before I start, take a look at this network animation created with R and the iGraph package. This animation is of a retweet network related to #BankTransferDay. Links (displayed as lines) are retweets, nodes (displayed as points) are user accounts. For each designated period of time (in this case, an hour), retweets are drawn and then fade out over 24 hours.
Tags: captura de conhecimento, data mining, grafos, R-software
Data Analysis Examples
Posted by Armando Brito Mendes | Filed under estatística, software

Bons exemplos de análises complexas com vários softwares
The pages below contain examples (often hypothetical) illustrating the application of different statistical analysis techniques using different statistical packages. Each page provides a handful of examples of when the analysis might be used along with sample data, an example analysis and an explanation of the output, followed by references for more information. These pages merely introduce the essence of the technique and do not provide a comprehensive description of how to use it.
Tags: captura de conhecimento, data mining, decisão médica, IBM SPSS Statistics, inferência, inquéritos, R-software, software estatístico
Easy web applications in R
Posted by Armando Brito Mendes | Filed under estatística, software
criar aplicações com R - deployment de modelos e análises
Shiny makes it super simple for R users like you to turn analyses into interactive web applications that anyone can use. Let your users choose input parameters using friendly controls like sliders, drop-downs, and text fields. Easily incorporate any number of outputs like plots, tables, and summaries.
No HTML or JavaScript knowledge is necessary. If you have some experience with R, you’re just minutes away from combining the statistical power of R with the simplicity of a web page.
Tags: análise de dados, data mining, desnvolvimento de software, R-software, software estatístico
The Siena webpage
Posted by Armando Brito Mendes | Filed under ARS - SNA, software

SIENA is a program for the statistical analysis of network data, with the focus on social networks.
Networks here are understood as entire (complete) networks, not as personal (egocentered) networks: it is assumed that a set of nodes (social actors) is given, and all ties (links) between these nodes are known – except perhaps for a moderate amount of missing data.
SIENA is designed for analyzing various types of data as dependent variables:
- Longitudinal network data:
- This refers to repeated measures of networks on a given node set (although it is allowed that there are some changes in the node set). Models can be specified with actor-oriented as well as tie-oriented dynamics.
- Longitudinal data of networks and behavior:
- This is like longitudinal network data, but in addition there are one or more changing nodal variables that are also treated as dependent variables, and referred to as behavior. The network will influence the dynamics of the behavior, and the behavior will influence the dynamics of the network. In other words, this is about the co-evolution of networks and behavior.
- Cross-sectional network data.
- ‘Cross-sectional’ means that only one observation is available. This method uses exponential random graph models (‘ERGMs’), also called p* models.
The ERG model is implemented in SIENA version 3, but not any more in version 4 (RSiena).
The name SIENA stands for Simulation Investigation for Empirical Network Analysis.
Tags: ARS\SNA intro, R-software
Ruth Ripley’s SNA Page
Posted by Armando Brito Mendes | Filed under ARS - SNA, materiais ensino

I teach two courses on programming in R. Slides etc for the (shared) lectures are here and extra resources for the M.Sc course are here.
My 1998 D.Phil. thesis, Neural Network Models for Breast Cancer Prognosis, is available for downloading in PDF (2.7mb) or 2-up PostScript (680kb).
S-PLUS survival analysis software (similar to that used in the thesis) is available for Unix and Windows. (Previous versions of the software are available for S-PLUS 3.4 and S-PLUS 2000.)
Slides from a seminar entitled Neural network based non-linear survival methods with applications to breast cancer prognosis are available for download as 4-up Postscript (zipped) (75kb)
Software for analysis of western medieval chant melodies, created in collaboration with the Oxchant Group in the Faculty of Music, is available here. A paper describing the work is available here.
A complete list of publications is available here.
Tags: ARS\SNA intro, R-software
Ruth Ripley’s R page
Posted by Armando Brito Mendes | Filed under estatística, materiais ensino
Muito material para ensino do R
I teach two courses on programming in R. Slides etc for the (shared) lectures are here and extra resources for the M.Sc course are here.
Tags: R-software
Tuturiais Video Linguagem R
Posted by Armando Brito Mendes | Filed under estatística, materiais ensino, videos
 A series of R for Statistical Programming screencasts that show you how to use R for Statistical Programming for text mining. R for Statistical Programming data mining, text mining, R for Statistical Programming, neural network, classification, clustering, R for Statistical Programming tutorial, R for Statistical Programming video, knowledge explorer, sentiment mining.
Tags: R-software