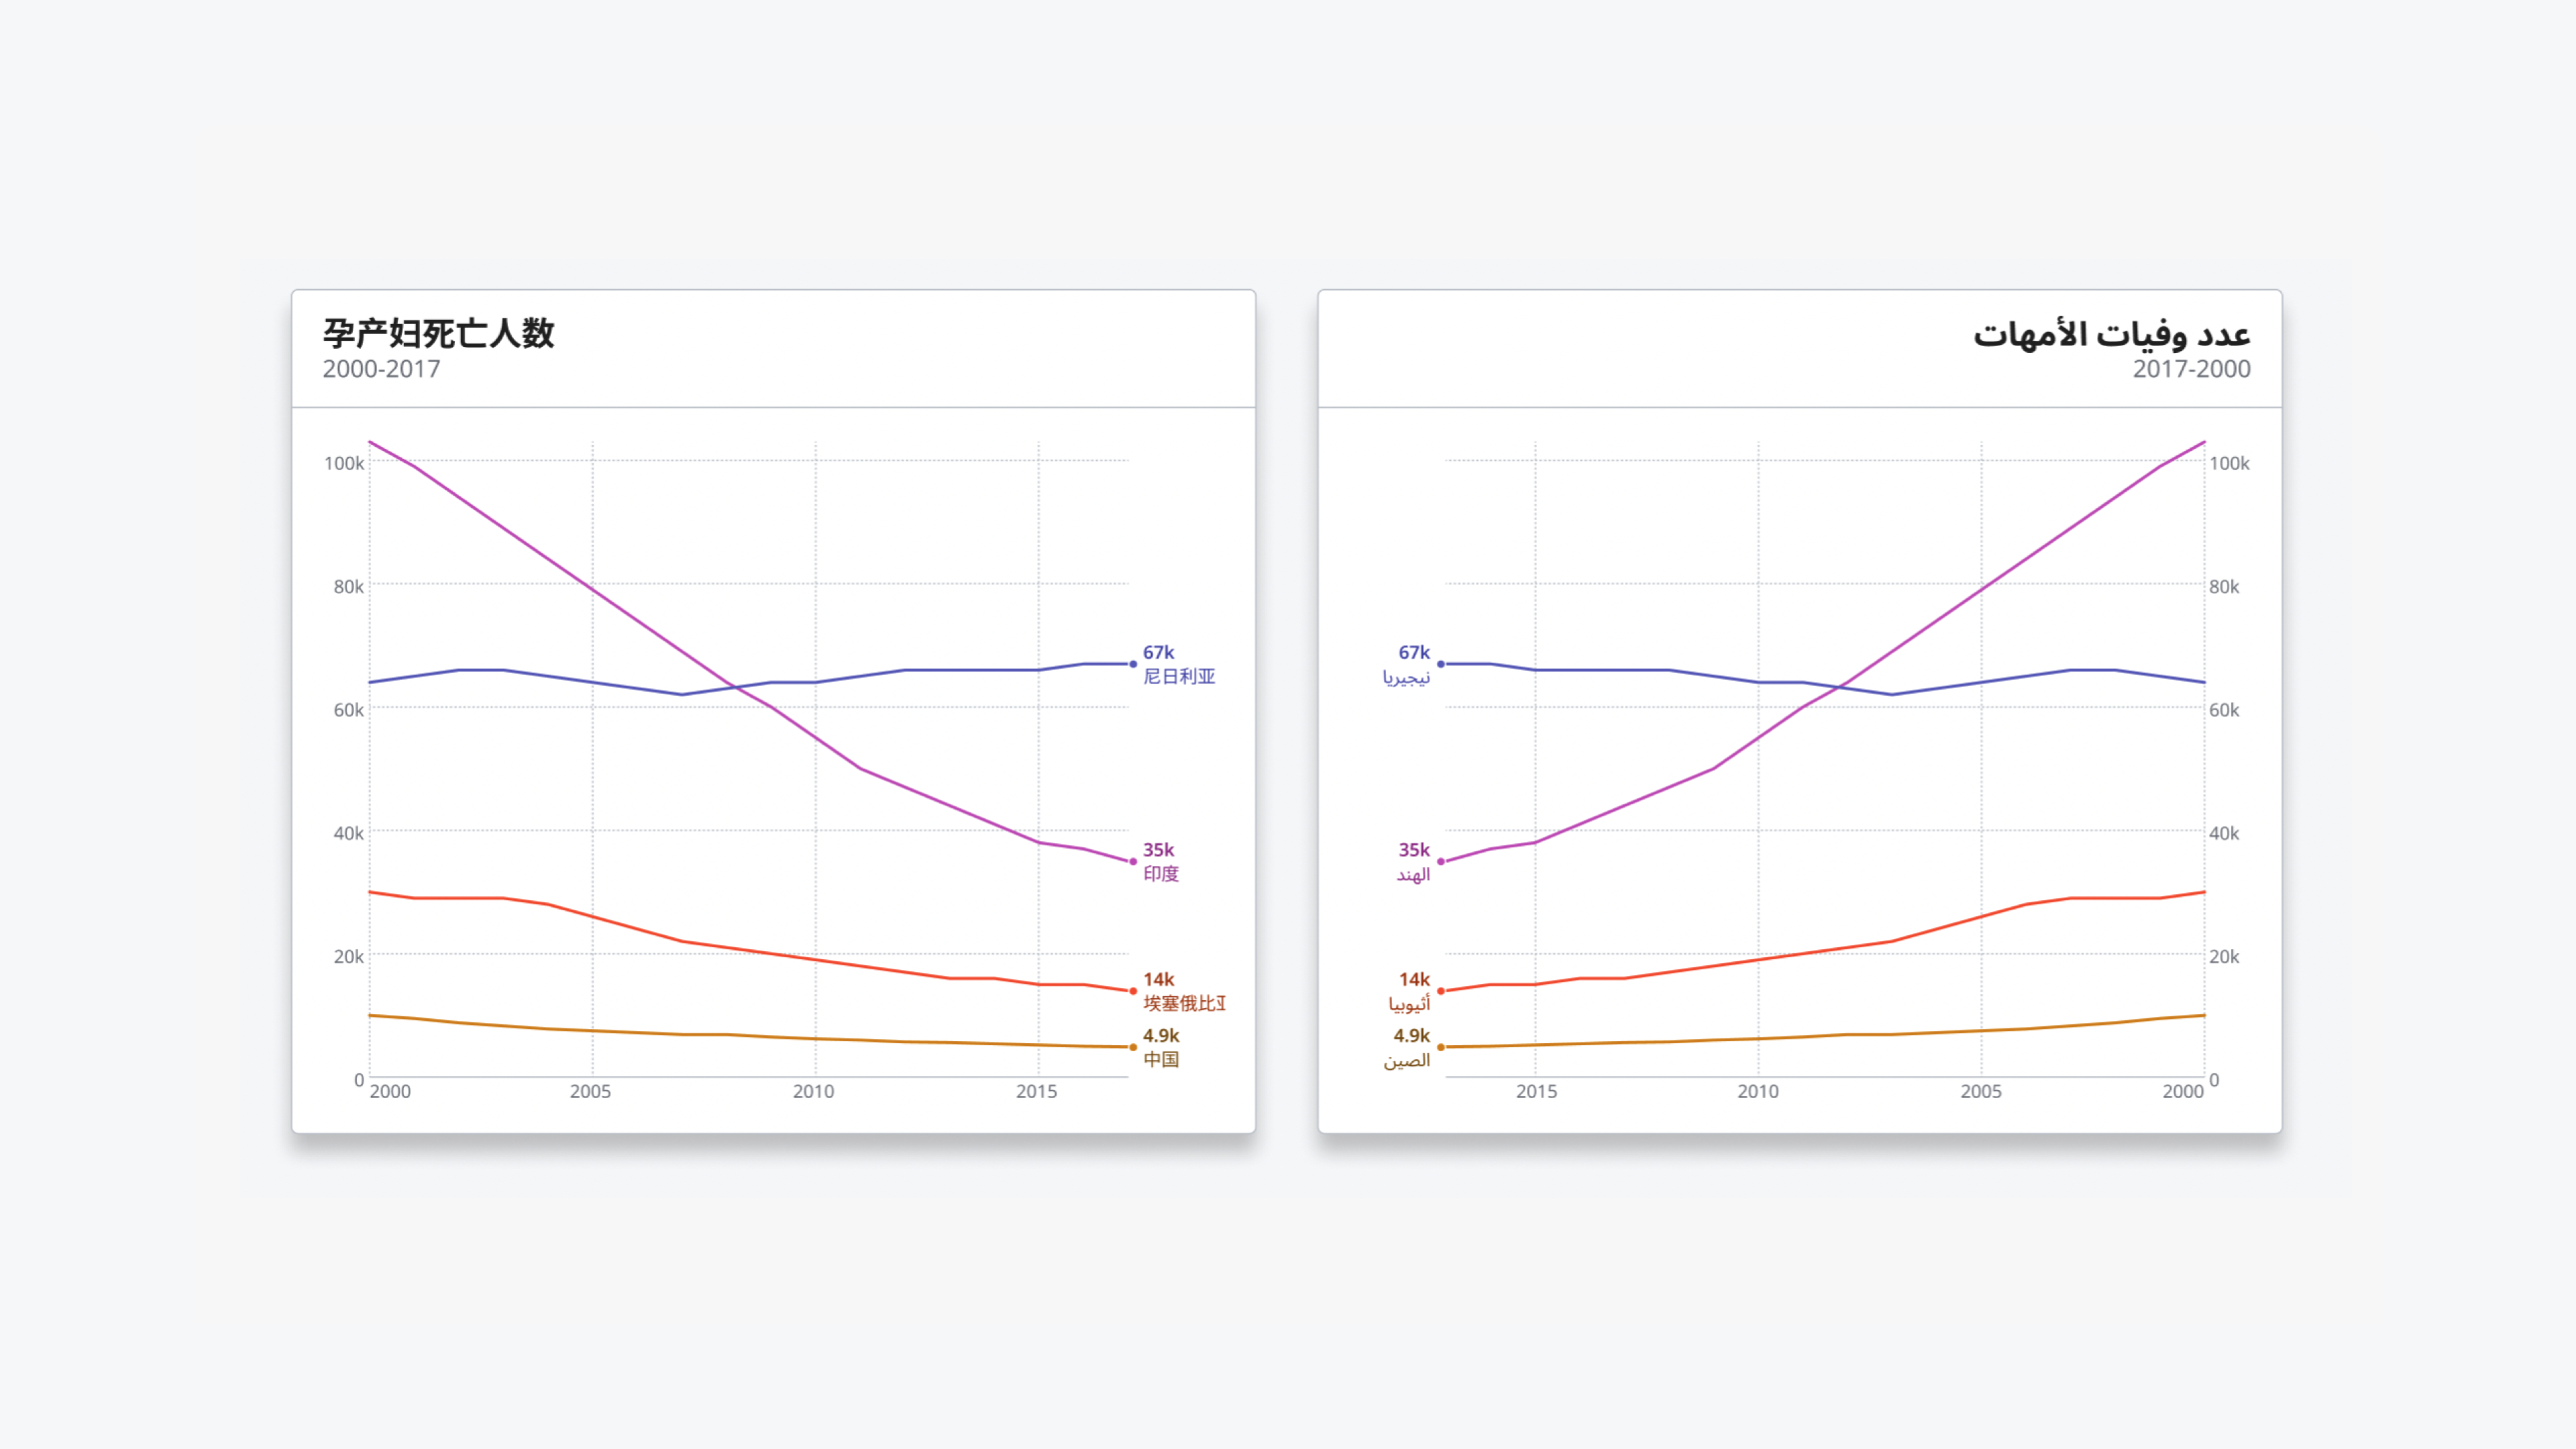
WHO Data Design Language
Posted by Armando Brito Mendes | Filed under visualização
Uma linguagem para desenho de dados
Rich data experiences for public health data
Developed for the data.who.int — the new home for WHO’s public health data — the WHO Data Design Language defines building blocks and techniques for creating rich, informative, accessible and equitable information experiences.
Team: Alice Thudt, Christian Laesser, Moritz Stefaner with Philippe Rivière, Sarah Fossheim, Maarten Lambrechts, with Mathias Schäfer, Leif Rothbrust, Philipp Doll and Matt Hollidge, Fred Wheeler, Yaseed Chaumoo.
Tags: cores, data design language
Chroma.js Color Palette Helper
Posted by Armando Brito Mendes | Filed under mapas SIG's, visualização
Uma ferramenta para usar a construir paletas para os seus gráficos
This chroma.js-powered tool is here to help us mastering multi-hued, multi-stops color scales.

