IBM SPSS product portfolio
Posted by Armando Brito Mendes | Filed under estatística, software

Página da IBM dedicada ao SPSS e co.
Why SPSS software?
With SPSS predictive analytics software, you can predict with confidence what will happen next so that you can make smarter decisions, solve problems and improve outcomes.
Tags: análise de dados, Estat Descritiva, IBM SPSS Statistics, inferência, previsão, software estatístico
How long will we live — and how well?
Posted by Armando Brito Mendes | Filed under estatística, visualização
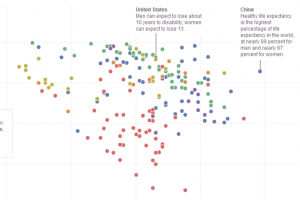
Gráfico animado de dispersão entre a esperança média de vida e a % de anos com saude
Circule entre os dois anos com informação para ver a animação.
For every year increase in life expectancy worldwide, healthy life expectancy increased about 9-1/2 months.
Tags: análise de dados, gestão de projetos
Visualização de dados FIFA
Posted by Armando Brito Mendes | Filed under visualização
visualizacao de BDs da FIFA sobre projetos de apoio ao futebol
Studio NAND and Moritz Stefaner, along with Jens Franke explore FIFA development programs around the world.
The FIFA Development Globe visualises FIFA’s worldwide involvement in supporting football through educational and infrastructural projects. Using a 3D globe in combination with interconnected interface and visualization elements, the application provides multiple perspectives onto an enormous dataset of FIFA’s activities, grouped by technical support, performance activities, and development projects.
The globe itself is an icosahedron, or essentially a spherical shape made up of triangles. Triangles in each country represent programs and are colored by the three above categories, and you might recognize Moritz’ elastic lists in the sidebar to filter through programs, by country, organization, and type. There’s also a timeline view, which shows program development over the past five years.
Give it a go here. I should warn you though that it runs in Flash (a client requirement), and it could run sluggish depending on your machine. Sometimes I was disorientated by the interaction and animation, especially when I clicked and nothing happened until a few seconds later.
FlowingData
Tags: análise de dados, Estat Descritiva, mapas
Easy web applications in R
Posted by Armando Brito Mendes | Filed under estatística, software

criar aplicações com R - deployment de modelos e análises
Shiny makes it super simple for R users like you to turn analyses into interactive web applications that anyone can use. Let your users choose input parameters using friendly controls like sliders, drop-downs, and text fields. Easily incorporate any number of outputs like plots, tables, and summaries.
No HTML or JavaScript knowledge is necessary. If you have some experience with R, you’re just minutes away from combining the statistical power of R with the simplicity of a web page.
Tags: análise de dados, data mining, desnvolvimento de software, R-software, software estatístico
Portal de Informação Empresarial do IRN
Posted by Armando Brito Mendes | Filed under data sets

Estatísticas Oficiais sobre a atividade empresarial
- Autonomia financeira
- Endividamento
- Margem líquida sobre as vendas (MLSV)
- Retorno do capital próprio (ROE)
- Volume de negócios
- Total de trabalhadores
- Trabalhadores a tempo parcial
- Trabalhadores afectos a Investigação e Desenvolvimento
- Trabalhadores não remunerados
- Total de declarações IES
- Total de declarações IES com anexo A
- Total de declarações IES com anexo A1
- Total de declarações IES com anexo B
- Total de declarações IES com anexo B1
- Total de declarações IES com anexo C
- Total de declarações IES com anexo C1
- Associação na hora
- Aumentos de capital
- Certificados de admissibilidade para alteração de empresa
- Certificados de admissibilidade para constituição de empresa
- Empresa na hora
- Empresa online
- Empresas com actividade internacional
- Empresas com comércio electrónico
- Empresas constituídas
- Empresas extintas
- Encargos Sociais
- Exportações
- Importações
- Médias empresas
- Micro empresas
- Pequenas empresas
- Remunerações
- Sucursal na hora
- Total de empresas
Tags: análise de dados
Modelos de dados
Posted by Armando Brito Mendes | Filed under estatística, Investigação Operacional, matemática, materiais ensino, videos
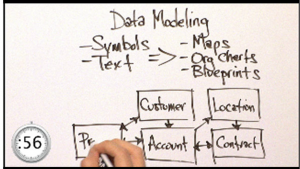
Tackling tough tech in a minute or less. This episode explores Data Modeling with Steve Hoberman, Data Modeling expert, author and educator.
Tags: análise de dados, data mining, otimização
Esri Maps for Office
Posted by Armando Brito Mendes | Filed under software, visualização
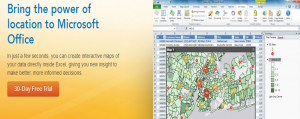
Map-Enable Your Data
Making a map of your Excel data is as easy as creating a graph or chart. Learn more.
Impact Your Audience
Add interactive maps to your PowerPoint presentations. Learn more.
Share Maps in One Click
Quickly share your maps on the web and with mobile apps. Learn more.
Tags: análise de dados, Excel, SIG
XpandIT – Exemplos de BI
Posted by Armando Brito Mendes | Filed under materiais ensino, SAD - DSS, software
Bom vídeo de empresa pt com exemplos de BI
Tags: análise de dados, captura de conhecimento, data mining
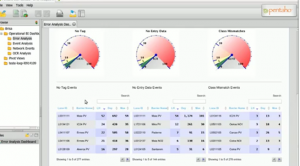
Pentaho – business analytics
Posted by Armando Brito Mendes | Filed under software

Software para BI e data werehouse
Better Together: Pentaho tightly couples data integration with business analytics in a modern platform that brings together IT and business users to easily access, visualize and explore all data that impacts business results
Tags: análise de dados, captura de conhecimento, data mining, decisão médica, inferência
PSPP – statistical analysis of sampled data
Posted by Armando Brito Mendes | Filed under estatística, software

Aplicação de análise estatística alternativa ao SPSS
A brief list of some of the features of PSPP follows:
- Supports over 1 billion cases.
- Supports over 1 billion variables.
- Syntax and data files are compatible with SPSS.
- Choice of terminal or graphical user interface.
- Choice of text, postscript or html output formats.
- Inter-operates with Gnumeric, OpenOffice.Org and other free software.
- Easy data import from spreadsheets, text files and database sources.
- User interface translated to multiple languages (details).
- Fast statistical procedures, even on very large data sets.
- No license fees.
- No expiration period.
- No unethical “end user license agreements”.
- Fully indexed user manual.
- Free Software; licensed under GPLv3 or later.
- Cross platform; Runs on many different computers and many different operating systems.
PSPP is particularly aimed at statisticians, social scientists and students requiring fast convenient analysis of sampled data.
Tags: análise de dados, Estat Descritiva, IBM SPSS Statistics, software estatístico