Docear – The Academic Literature Suite
Posted by Armando Brito Mendes | Filed under materiais para profissionais, refs bibliográficas, software
Docear is a unique solution to academic literature management, i.e. it helps you organizing, creating, and discovering academic literature. Among others, Docear offers:
- A single-section user-interface that allows the most comprehensive organization of your literature. With Docear, you can sort documents into categories; you can sort annotations (comments, bookmarks, and highlighted text from PDFs) into categories; you can sort annotations within PDFs; and you can view multiple annotations of multiple documents, in multiple categories – at once.
- A ‘literature suite concept‘ that combines several tools in a single application (pdf management, reference management, mind mapping, …). This allows you to draft your own papers, assignments, thesis, etc. directly in Docear and copy annotations and references from your collection directly into your draft.
- A recommender system that helps you to discover new literature: Docear recommends papers which are free, in full-text, instantly to download, and tailored to your information needs.
And did we mention that Docear is free, open source, available for Windows, Linux, and Mac OS X, and not evil?
Tags: gestão de projetos, motores de busca, text mining
In flight: see the planes in the sky right now
Posted by Armando Brito Mendes | Filed under visualização
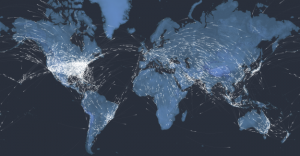
To mark 100 years of passenger air travel, our stunning interactive uses live data to show every one of the thousands of commercial planes currently in the air, charts the history of aviation since 1914, and asks what comes next for the industry.
Kiln and the Guardian explored the 100-year history of passenger air travel, and to kick off the interactive is an interactive map that uses live flight data from FlightStats. The map shows all current flights in the air right now. Nice.
Be sure to click through all the tabs. They’re worth the watch and listen, with a combination of narration, interactive charts, and old photos.
And of course, if you like this, you’ll also enjoy Aaron Koblin’s classic Flight Patterns.
Tags: belo, big data, data mining
Music Timeline
Posted by Armando Brito Mendes | Filed under visualização
Two Google research groups, Big Picture and Music Intelligence, got together and made a music timeline baby.
The Music Timeline shows genres of music waxing and waning, based on how many Google Play Music users have an artist or album in their music library, and other data (such as album release dates). Each stripe on the graph represents a genre; the thickness of the stripe tells you roughly the popularity of music released in a given year in that genre. (For example, the “jazz” stripe is thick in the 1950s since many users’ libraries contain jazz albums released in the ’50s.) Click on the stripes to zoom into more specialized genres.
As you’d expect, the initial view is a stacked area chart that represents the popularity of genres over time, which feels fairly familiar, but then you interact with the stacks and it gets more interesting and almost surprisingly fast. The best part is the pointers to specific albums as you mouse over.
Tags: belo, big data, data mining, DW \ BI
Lexical Distance Among the Languages of Europe
Posted by Armando Brito Mendes | Filed under Investigação Operacional, visualização
This chart shows the lexical distance — that is, the degree of overall vocabulary divergence — among the major languages of Europe.
The size of each circle represents the number of speakers for that language. Circles of the same color belong to the same language group. All the groups except for Finno-Ugric (in yellow) are in turn members of the Indo-European language family.
English is a member of the Germanic group (blue) within the Indo-European family. But thanks to 1066, William of Normandy, and all that, about 75% of the modern English vocabulary comes from French and Latin (ie the Romance languages, in orange) rather than Germanic sources. As a result, English (a Germanic language) and French (a Romance language) are actually closer to each other in lexical terms than Romanian (a Romance language) and French.
Tags: ARS\SNA applicações, belo, data mining, grafos
Apache Spark
Posted by Armando Brito Mendes | Filed under materiais para profissionais, software
What is Apache Spark?
Apache Spark is an open source cluster computing system that aims to make data analytics fast — both fast to run and fast to write.
To run programs faster, Spark offers a general execution model that can optimize arbitrary operator graphs, and supports in-memory computing, which lets it query data faster than disk-based engines like Hadoop.
To make programming faster, Spark provides clean, concise APIs in Scala, Java and Python. You can also use Spark interactively from the Scala and Python shells to rapidly query big datasets.
What can it do?
Spark was initially developed for two applications where placing data in memory helps: iterative algorithms, which are common in machine learning, and interactive data mining. In both cases, Spark can run up to 100x faster than Hadoop MapReduce. However, you can use Spark for general data processing too. Check out our example jobs.
Spark is also the engine behind Shark, a fully Apache Hive-compatible data warehousing system that can run 100x faster than Hive.
While Spark is a new engine, it can access any data source supported by Hadoop, making it easy to run over existing data.
Tags: análise de dados, big data, data mining, DW \ BI
Century of rock history
Posted by Armando Brito Mendes | Filed under visualização
Jessica Edmondson visualized the history of rock music, from foundations in the pre-1900s to a boom in the 1960s and finally to what we have now. Nodes represent music styles, and edges represent musical connections. There are a lot of them and as a whole it’s a screen of spaghetti, but it’s animated, which is key. It starts at the beginning and develops over time, so you know where to go and what to look at. Music samples for each genre is also a nice touch. [Thanks, Jessica]
Tags: ARS\SNA applicações, ARS\SNA intro, belo, captura de conhecimento, grafos
introducing R to a non-programmer in one hour
Posted by Armando Brito Mendes | Filed under estatística, materiais ensino, software
Biostatistics PhD candidate Alyssa Frazee was tasked with teaching her sister, an undergraduate in sociology, how to use R. She had only one hour.
Once you load in a dataset, things start to get fun. We learned a whole bunch of stuff from this data frame, like how to do basic tabulations and calculate summary statistics, how to figure out if you have missing data, and how to fit a simple linear model. This part was pretty fun because my sister started leading the session: instead of me saying “I’m going to show you how to do this,” it was her asking “Hey, could we make a scatterplot?” or “Do you think we could put the best-fit line on that plot?” I was really glad this happened — I hope it meant she was engaged and enjoying herself!
This is the nice thing about R. There are so many built-in functions and packages that you can get something useful with a few lines of code, and you don’t really even have to know what a function is to get started (although you should eventually). Then you can go as far down the rabbit hole as you want.
Tags: análise de dados, bioinformatica, Estat Descritiva, R-software, software estatístico
What is Apache Mahout?
Posted by Armando Brito Mendes | Filed under software
The Apache Mahout™ machine learning library’s goal is to build scalable machine learning libraries.
Mahout currently has
- User and Item based recommenders
- Matrix factorization based recommenders
- K-Means, Fuzzy K-Means clustering
- Latent Dirichlet Allocation
- Singular value decomposition
- Logistic regression based classifier
- Complementary Naive Bayes classifier
- Random forest decision tree based classifier
- High performance java collections (previously colt collections)
- A vibrant community
With scalable we mean:
Scalable to reasonably large data sets. Our core algorithms for clustering, classfication and collaborative filtering are implemented on top of Apache Hadoop using the map/reduce paradigm. However we do not restrict contributions to Hadoop based implementations: Contributions that run on a single node or on a non-Hadoop cluster are welcome as well. The core libraries are highly optimized to allow for good performance also for non-distributed algorithms
Scalable to support your business case. Mahout is distributed under a commercially friendly Apache Software license.
Tags: big data, data mining, DW \ BI
The Age of Data
Posted by Armando Brito Mendes | Filed under estatística, videos
Whiteboards
The Age of Data
Actian Big Data Analytics Platform
Actian DataCloud Platform
Big Data Analytics
Creating Value from Big Data and Hadoop
A New World for Analytics
The Need for an Analytic Platform
Seamless Integration
Analytic Offload
Creating Business Value with Analytics
Tags: big data, data mining, DW \ BI, Estat Descritiva
Big Data or Pig Data?
Posted by Armando Brito Mendes | Filed under materiais para profissionais
(A fable on huge amounts of data and why we don’t need models)
There was a pig who wanted to be a scientist. He was not interested in models. When asked how he planned on making sense of the world, the pig would say in a deep mysterious voice, “I don’t do models: the world is my model” and then with a twinkle in his eyes, look at his interlocutor smugly.
By his phrase, “I don’t do models, the world is my model”, he meant that the world’s data was enough for him, the pig scientist. The more the data, the more accurately the pig declared, he would be able to predict what might happen in the world.
Tags: big data, data mining, DW \ BI


