Rtips. Revival 2014!
Posted by Armando Brito Mendes | Filed under estatística, matemática, software

Uma animação com todos os lugares referidos numa canção de johnny cash
Montes de exemplos de R numa única longa página.
Tags: análise de dados, Estat Descritiva, inferência, R-software, software estatístico
Rice Virtual Lab in Statistics
Posted by Armando Brito Mendes | Filed under estatística, materiais ensino

clique na imagem para seguir o link
Referências úteis para conceitos de estatística básica.
 |
HyperStat Online An online statistics book with links to other statistics resources on the web. |
| Simulations/Demonstrations Java applets that demonstrate various statistical concepts. |
|
 |
Case Studies Examples of real data with analyses and interpretation |
| Analysis Lab Some basic statistical analysis tools. |
Tags: Estat Descritiva, inferência
Electronic Statistics Textbook: StatSoft
Posted by Armando Brito Mendes | Filed under estatística, materiais ensino, refs bibliográficas

clique na imagem para seguir o link
Uma referência muito completa sobre métodos estatísticos e de data mining.
Proper citation:
- (Electronic Version): StatSoft, Inc. (2013). Electronic Statistics Textbook. Tulsa, OK: StatSoft. WEB: http://www.statsoft.com/textbook/.
- (Printed Version): Hill, T. & Lewicki, P. (2007). STATISTICS: Methods and Applications. StatSoft, Tulsa, OK.
Overview of Elementary Concepts in Statistics. In this introduction, we will briefly discuss those elementary statistical concepts that provide the necessary foundations for more specialized expertise in any area of statistical data analysis. The selected topics illustrate the basic assumptions of most statistical methods and/or have been demonstrated in research to be necessary components of one’s general understanding of the “quantitative nature” of reality (Nisbet, et al., 1987). Because of space limitations, we will focus mostly on the functional aspects of the concepts discussed and the presentation will be very short.
Further information on each of those concepts can be found in the Introductory Overview and Examples sections of this manual and in statistical textbooks. Recommended introductory textbooks are: Kachigan (1986), and Runyon and Haber (1976); for a more advanced discussion of elementary theory and assumptions of statistics, see the classic books by Hays (1988), and Kendall and Stuart (1979).
Tags: análise de dados, data mining, Estat Descritiva, qualidade
Montes de recursos sobre R
Posted by Armando Brito Mendes | Filed under estatística, materiais ensino, software

clique na imagem para abrir o link
Muitos recursos para o R que vão de exemplos introdutórios até ao multivariado.
|
Do it yourself Introduction to R R is a free statistical programming language environment. It is completely free to anyone — like the air you breath is free. For more information on why everyone should be using R, see here. |
|
|---|---|
|
The goal of this site is to allow someone to overcome the intimidation associated with learning the very basics of R and showing them the tools for continued usage. Let’s get started. Some assumptions: This site assumes you are using a Windows operating system and have a basic understanding of file structures and paths. You will also need to have administrator privileges in order to install R. Some of the notes linked on this page are standard HTML pages; most of the links on this page are in R script file format (they have the file extension.R). Beyond that; the site and any instructions or links on it should be self-explanatory. It is STRONGLY recommended that one progress through the modules in order. A brief explanation of this page is here. UPDATE NOTE: April 23, 2015: current R version is 3.2.0 These pages have been tested for use with Firefox, other browsers may display the pages incorrectly. |
Tags: análise de dados, data mining, Estat Descritiva, R-software, software estatístico
Base R Version
Posted by Armando Brito Mendes | Filed under estatística, materiais ensino, software, visualização
clicar na imagem para seguir o link
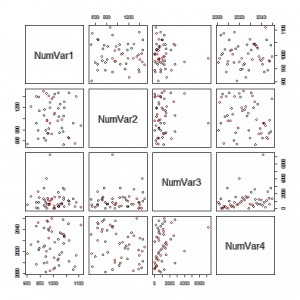
Excelentes exemplos de gráficos que podem usar nos trabalhos.
One Variable: Numeric Variable
One Variable: Factor Variable
Two Variables: Two Numeric Variables
Two Variables: Two Factor Variables
Two Variables: One Factor and One Numeric
Three Variables: Three Factor Variables
Three Variables: One Numeric and Two Factor Variables
Three Variables: Two Numeric and One Factor Variables
Three Variables: Three Numeric Variables
Scatterplot Matrix of all Numeric Vars, colored by a Factor variable
Tags: Estat Descritiva, R-software, software estatístico
SticiGui – online statistics book
Posted by Armando Brito Mendes | Filed under estatística, materiais ensino
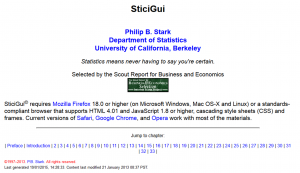
clique na imagem para seguir a ligação
- Chapter 0, Preface.
- Chapter 1, Introduction.
- Chapter 2, Reasoning and Fallacies.
-
- Rules of reasoning, arguments, validity and soundness, some valid rules of reasoning, formal fallacies, common formal fallacies, informal fallacies, fallacies of relevance and fallacies of evidence, fallacies of relevance, common fallacies of relevance, fallacies of evidence, common fallacies of evidence, summary, key terms.
- Chapter 3, Statistics.
- Chapter 4, Measures of Location and Spread.
- Chapter 5, Multivariate Data and Scatterplots.
- Chapter 6, Association.
- Chapter 7, Correlation and Association.
-
- The correlation coefficient, the effect of nonlinear association, homoscedasticity and heteroscedasticity and outliers on the correlation coefficient, summary, key terms.
- Chapter 8, Computing the Correlation Coefficient.
- Chapter 9, Regression.
- Chapter 10, Regression Diagnostics.
- Chapter 11, Errors in Regression.
- Chapter 12, Counting.
- Chapter 13, The Meaning of Probability: Theories of probability.
- Chapter 14, Set Theory: The Language of Probability.
- Chapter 15, Categorical Logic.
- Chapter 16, Propositional Logic.
- Chapter 17, Probability: Axioms and Fundaments.
- Chapter 18, The “Let’s Make a Deal” (Monty Hall) Problem.
- Chapter 19, Probability Meets Data.
- Chapter 20, Random Variables and Discrete Distributions.
-
- Random variables, sampling from 0-1 boxes, geometric distribution, the negative binomial distribution, sampling without replacement, the hypergeometric distribution, calculating binomial, geometric, hypergeometric, and negative binomial probabilities, discrete distributions, case study: trade secret litigation, summary, key terms.
- Chapter 21, The Long Run and the Expected Value.
-
- The Law of Large Numbers, implications of the law of large numbers, expected value of a random variable, expected value of the sample sum, expected value of binomial hypergeometric distributions, properties of the expected value, expected value of the sample mean and sample percentage, gambling and fair bets, expected values of some common distributions, summary, key terms.
- Chapter 22, Standard Error.
-
- Expected value of a transformation of a random variable, standard error of random variables, the standard error transformations of a random variable, independent random variables, standard errors of some common random variables, the SE of a single draw from a box of numbered tickets, SE of the sample sum of n random draws with replacement from a Box of Tickets, the SE of the sample mean of n random draws from a box of numbered tickets, the square-root law, the law of averages, the standard error of the binomial, geometric and negative binomial distributions, SE of the sample sum and mean of a simple random sample, the SE of the hypergeometric distribution, the finite population correction, summary, key terms.
- Chapter 23, The Normal Curve, the Central Limit Theorem, and Markov’s and Chebychev’s Inequalities for Random Variables.
-
- The normal approximation, standard units for random variables, the normal curve, the normal approximation to probability histograms, the continuity correction, the normal approximation to the hypergeometric distribution, Markov’s and Chebychev’s inequalities for random variables, summary, key terms.
- Chapter 24, Sampling.
-
- Parameters and statistics, why sample?, sample surveys, The Hite Report, bias in surveys, Sampling designs: cluster sampling, stratified sampling, multistage sampling, hybrid designs, ways of drawing samples, convenience samples, quota samples, systematic samples, probability samples, simple random samples, systematic random samples, Sampling from hypothetical populations, summary, key terms.
- Chapter 25, Estimating Parameters from Simple Random Samples.
-
- Quantifying the error of estimators: bias, standard error, and mean squared error, estimating means and percentages, a conservative estimate of the SE of the sample percentage, the Bootstrap estimate of the SD of a list of zeros and ones, the sample standard deviation and the sample variance, caveats, summary, key terms.
- Chapter 26, Confidence Intervals.
-
- Confidence intervals, conservative confidence intervals for percentages, conservative confidence intervals for the mean of bounded populations, approximate confidence intervals for percentages, approximate confidence intervals for the population mean, exact confidence intervals for percentages, confidence intervals for the median and percentiles, summary.
- Chapter 27, Hypothesis Testing: Does Chance explain the Results?.
-
- Hypothesis testing, Examples of hypothesis testing problems, significance level and power, test statistics and P-values, hypotheses about parameters; one-sided and two-sided alternatives, case study: employment discrimination, caveats, the meaning of rejection, statistical significance and practical importance, interpreting P-values, multiplicity and data mining, garbage in, garbage out, summary.
- Chapter 28, Does Treatment Have an Effect?.
-
- The Method of Comparison, confounding, historical controls, longitudinal and cross-sectional comparisons, Simpson’s Paradox, experiments and observational studies, assessing online instructions, the Placebo Effect, John Snow’s study of the mode of communication of cholera, The Kassel Dowsing Experiment, summary.
- Chapter 29, Testing Equality of Two Percentages.
-
- Fisher’s Exact Test for an effect–dependent samples, the normal approximation to Fisher’s Exact Test, testing equality of two percentages using independent samples, Fisher’s Exact Test using independent samples, the Z test for the equality of two percentages using independent Samples, the normal approximation to Fisher’s exact test and the z Test, summary, key terms.
- Chapter 30, Approximate Hypothesis Tests: the z Test and the t Test.
-
- z Tests, P values for z tests, examples of z tests, z test for a population percentage, the z test for a population mean, z-test for a difference of population means (paired samples, independent samples), t tests, nearly normally distributed populations, Student’s t-curve, t test for the mean of a nearly normal population, hypothesis tests and confidence intervals, confidence intervals using Student’s t curve, summary, key terms
- Chapter 31, The Multinomial Distribution and the Chi-Squared Test for Goodness of Fit.
Tags: Estat Descritiva, inferência
PlotDevice: Draw with Python
Posted by Armando Brito Mendes | Filed under estatística, materiais para profissionais, software, visualização
clicar na imagem para seguir o link
Uma biblioteca de funções em Pyton para construir visualizações de dados.
You’ve been able to visualize data with Python for a while, but Mac application PlotDevice from Christian Swinehart couples code and graphics more tightly. Write code on the right. Watch graphics change on the right.
The application gives you everything you need to start writing programs that draw to a virtual canvas. It features a text editor with syntax highlighting and tab completion plus a zoomable graphics viewer and a variety of export options.
PlotDevice’s simple but comprehensive set of graphics commands will be familiar to users of similar graphics tools like NodeBox or Processing. And if you’re new to programming, you’ll find there’s nothing better than being able to see the results of your code as you learn to think like a computer.
Looks promising. Although when I downloaded it and tried to run it, nothing happened. I’m guessing there’s still compatibility issues to iron out at version 0.9.4. Hopefully that clears up soon. [via Waxy]
Tags: big data, data mining, desnvolvimento de software, Estat Descritiva
How People in America Spend Their Day
Posted by Armando Brito Mendes | Filed under estatística, visualização
clicar na imagem para seguir o link
Um gráfico de áreas como forma de visualizar como os americanos ocupam o seu tempo ao longo do dia.
»
From Shan Carter, Amanda Cox, Kevin Quealy, and Amy Schoenfeld of The New York Times is this new interactive stacked time series on how different groups in America spend their day. The data itself comes from the American Time Use Survey. The interactive has a similar feel to Martin Wattenberg’s Baby Name Voyager, but it has the NYT pizazz that we’ve all come to know and love.
Explore time use by gender, race, age, education, and employment. View all activities (e.g. work, traveling) or select a specific action to drill down into the graph. From there, you’ll find time aggregates that you can compare against depending on what filter you’ve selected.
Tags: belo, big data, data mining, Estat Descritiva
A World of Terror
Posted by Armando Brito Mendes | Filed under estatística, materiais para profissionais, visualização

Uma excelente visualização de dados interativa
Exploring the reach, frequency and impact of terrorism around the world
The data used in this tool comes from the Global Terrorism Database, the most comprehensive collection of terrorism data available.
Tags: belo, Estat Descritiva
Using Open Source Technology in Higher Education
Posted by Armando Brito Mendes | Filed under estatística, software
Um blogue com muitos posts sobre a utilização do R
Using R for Basic Cross Tabulation Analysis: Part Three, Using the xtabs Function
crosstabsrr programmingr statisticstable analysis
Using R to Work with GSS Survey Data: Cross Tabulation Tables
chi squaredcross tablescrosstabsrr programmingr statisticstable analysis
R Tutorial: Using R to Work With Datasets From the NORC General Social Science Survey
create csv filefile conversionrr programmingr statisticsr tutorialread spss filesresearch
How to Set Up SSH to Remotely Control Your Raspberry Pi
mmand lineraspberry piraspberry pi computingRaspberry Pi Software Configuationremote access with sshset up sshsshterminal program
Tags: análise de dados, data mining, desnvolvimento de software, Estat Descritiva, R-software, software estatístico