SQL Server Data Mining News
Posted by Armando Brito Mendes | Filed under Bases de Dados
Um site com visão da microsoft para o data mining
Welcome to SQLServerDataMining.com
This site has been designed by the SQL Server Data Mining team to provide the SQL Server community with access to and information about our in-database data mining and analytics features. SQL Server 2000 was the first major database release to put analytics in the database. Catch up with the latest SQL Server Data Mining news in our newsletter.
SQL Server 2012 SP1 Data Mining Add-ins for Office (with 32-bit or 64-bit Support)
The Data Mining Add-ins allow you to harness the power of SQL Server 2012 predictive analytics in Excel and Visio and they have been updated to include 32-bit or 64-bit support for Office 2010 or Office 2013. Use Table Analysis Tools to get insight with a couple of clicks. Use the Data Mining tab for full-lifecycle data mining, and build models which can be exported to a production server. Visualize your models in Visio.
SQL Server 2012 Data Mining
Microsoft expert Rafal Lukawiecki provides free and paid videos on data mining for SQL Server 2012 at Project Botticelli. The website has other Microsoft BI topics too from leading Microsoft experts.
SQL Server DM with Excel 2010 and PowerPivot
Microsoft MVP Mark Tabladillo shows you how to unleash SQL Server 2008 Data Mining with Excel 2010 and SQL Server PowerPivot for Excel, Microsoft’s new self-service BI offering.
Tags: data mining, DW \ BI, SQL, text mining
Os portugueses durante o euro com dados do multibanco
Posted by Armando Brito Mendes | Filed under estatística, visualização
Um bom exemplo da utilização de dados para inferir comportamentos mas a parte das coincidências de valores era dispensável
Como conquistámos o Euro 2016 através do Multibanco (com infografia)
Publicado em: 20/07/2016 – 19:11:26
À hora da final entre Portugal e França, o país parou… e os levantamentos também! Conheça esta e outras curiosidades que marcaram o comportamento dos portugueses com a rede Multibanco à medida que os 23 magníficos conquistavam o Europeu 2016
Guardar
Guardar
Tags: belo, big data, data mining, DW \ BI
The Many Faces of ROC Analysis
Posted by Armando Brito Mendes | Filed under materiais para profissionais
Bom tutorial sobre curvas ROC
Receiver Operating Characteristics (ROC) Analysis originated from signal detection theory, as a model of how well a receiver is able to detect a signal in the presence of noise. Its key feature is the distinction between hit rate (or true positive rate) and false alarm rate (or false positive rate) as two separate performance measures. ROC analysis has also widely been used in medical data analysis to study the effect of varying the threshold on the numerical outcome of a diagnostic test. It has been introduced to machine learning relatively recently, in response to classification tasks with varying class distributions or misclassification costs (hereafter referred to as skew). ROC analysis is set to cause a paradigm shift in machine learning. Separating performance on classes is almost always a good idea from an analytical perspective. For instance, it can help us to
- understand the behaviour and skew-sensitivity of many machine learning metrics, including rule learning heuristics and decision tree splitting criteria, by plotting their isometrics in ROC space;
- develop new metrics specifically designed to improve the Area Under the ROC Curve (AUC) of a model;
- understand fundamental algorithms such as the separate-and-conquer or sequential covering rule learning algorithm, by tracing its trajectory through a sequence of ROC spaces.
The goal of this tutorial is to develop the ROC perspective in a systematic way, demonstrating the many faces of ROC analysis in machine learning.
Tags: data mining, DW \ BI, machine learning
What is Data Virtualization?
Posted by Armando Brito Mendes | Filed under videos
Muito clara introdução ao tema da virtualização de dados.
What is Data Virtualization?
5 882
Tags: big data, data mining, DW \ BI
Music Timeline
Posted by Armando Brito Mendes | Filed under visualização
Two Google research groups, Big Picture and Music Intelligence, got together and made a music timeline baby.
The Music Timeline shows genres of music waxing and waning, based on how many Google Play Music users have an artist or album in their music library, and other data (such as album release dates). Each stripe on the graph represents a genre; the thickness of the stripe tells you roughly the popularity of music released in a given year in that genre. (For example, the “jazz” stripe is thick in the 1950s since many users’ libraries contain jazz albums released in the ’50s.) Click on the stripes to zoom into more specialized genres.
As you’d expect, the initial view is a stacked area chart that represents the popularity of genres over time, which feels fairly familiar, but then you interact with the stacks and it gets more interesting and almost surprisingly fast. The best part is the pointers to specific albums as you mouse over.
Tags: belo, big data, data mining, DW \ BI
Apache Spark
Posted by Armando Brito Mendes | Filed under materiais para profissionais, software
What is Apache Spark?
Apache Spark is an open source cluster computing system that aims to make data analytics fast — both fast to run and fast to write.
To run programs faster, Spark offers a general execution model that can optimize arbitrary operator graphs, and supports in-memory computing, which lets it query data faster than disk-based engines like Hadoop.
To make programming faster, Spark provides clean, concise APIs in Scala, Java and Python. You can also use Spark interactively from the Scala and Python shells to rapidly query big datasets.
What can it do?
Spark was initially developed for two applications where placing data in memory helps: iterative algorithms, which are common in machine learning, and interactive data mining. In both cases, Spark can run up to 100x faster than Hadoop MapReduce. However, you can use Spark for general data processing too. Check out our example jobs.
Spark is also the engine behind Shark, a fully Apache Hive-compatible data warehousing system that can run 100x faster than Hive.
While Spark is a new engine, it can access any data source supported by Hadoop, making it easy to run over existing data.
Tags: análise de dados, big data, data mining, DW \ BI
What is Apache Mahout?
Posted by Armando Brito Mendes | Filed under software
The Apache Mahout™ machine learning library’s goal is to build scalable machine learning libraries.
Mahout currently has
- User and Item based recommenders
- Matrix factorization based recommenders
- K-Means, Fuzzy K-Means clustering
- Latent Dirichlet Allocation
- Singular value decomposition
- Logistic regression based classifier
- Complementary Naive Bayes classifier
- Random forest decision tree based classifier
- High performance java collections (previously colt collections)
- A vibrant community
With scalable we mean:
Scalable to reasonably large data sets. Our core algorithms for clustering, classfication and collaborative filtering are implemented on top of Apache Hadoop using the map/reduce paradigm. However we do not restrict contributions to Hadoop based implementations: Contributions that run on a single node or on a non-Hadoop cluster are welcome as well. The core libraries are highly optimized to allow for good performance also for non-distributed algorithms
Scalable to support your business case. Mahout is distributed under a commercially friendly Apache Software license.
Tags: big data, data mining, DW \ BI
The Age of Data
Posted by Armando Brito Mendes | Filed under estatística, videos
Whiteboards
The Age of Data
Actian Big Data Analytics Platform
Actian DataCloud Platform
Big Data Analytics
Creating Value from Big Data and Hadoop
A New World for Analytics
The Need for an Analytic Platform
Seamless Integration
Analytic Offload
Creating Business Value with Analytics
Tags: big data, data mining, DW \ BI, Estat Descritiva
Big Data or Pig Data?
Posted by Armando Brito Mendes | Filed under materiais para profissionais
(A fable on huge amounts of data and why we don’t need models)
There was a pig who wanted to be a scientist. He was not interested in models. When asked how he planned on making sense of the world, the pig would say in a deep mysterious voice, “I don’t do models: the world is my model” and then with a twinkle in his eyes, look at his interlocutor smugly.
By his phrase, “I don’t do models, the world is my model”, he meant that the world’s data was enough for him, the pig scientist. The more the data, the more accurately the pig declared, he would be able to predict what might happen in the world.
Tags: big data, data mining, DW \ BI
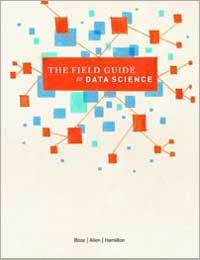
The Field Guide to Data Science
Posted by Armando Brito Mendes | Filed under materiais para profissionais
Data Science is the competitive advantage of the future for organizations interested in turning their data into a product through analytics. Industries from health, to national security, to finance, to energy can be improved by creating better data analytics through Data Science. The winners and the losers in the emerging data economy are going to be determined by their Data Science teams.
Booz Allen Hamilton created The Field Guide to Data Science to help organizations of all types and missions understand how to make use of data as a resource. The text spells out what Data Science is and why it matters to organizations as well as how to create Data Science teams. Along the way, our team of experts provides field-tested approaches, personal tips and tricks, and real-life case studies. Senior leaders will walk away with a deeper understanding of the concepts at the heart of Data Science. Practitioners will add to their toolboxes.
Tags: big data, captura de conhecimento, data mining, DW \ BI


