Cursos da Stanford Engineering
Posted by Armando Brito Mendes | Filed under materiais ensino

Standford On-line Courses
SEE programming includes one of Stanford’s most popular engineering sequences: the three-course Introduction to Computer Science taken by the majority of Stanford undergraduates, and seven more advanced courses in artificial intelligence and electrical engineering.
Tags: b-learning, data mining
Problems with Gantt Charts
Posted by Armando Brito Mendes | Filed under Investigação Operacional, planeamento, visualização
Project Management Graphics (or Gantt Charts), by Edward Tufte
Computer screens are generally too small for an overview of big serious projects. Horizontal and vertical scrolling are necessary to see more than about 40 horizontal time lines for a reasonable period of time. Thus, for large projects, print out the sequence on a big roll of paper and put it up on a wall.
Tags: gestão de projetos
What is Social Network Analysis?
Posted by Armando Brito Mendes | Filed under ARS - SNA

Uma boa definição de redes sociais
Network analysis is based on the intuitive notion that these patterns are important features of the lives of the individuals who display them. Network analysts believe that how an individual lives depends in large part on how that individual is tied into the larger web of social connections. Many believe, moreover, that the success or failure of societies and organizations often depends on the patterning of their internal structure.
Tags: ARS\SNA intro, definição, grafos
Analysis of Risky Decisions
Posted by Armando Brito Mendes | Filed under Investigação Operacional, materiais ensino
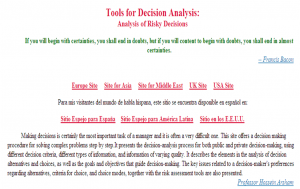
Analysis of Risky Decisions
Making decisions is certainly the most important task of a manager and it is often a very difficult one. This site offers a decision making procedure for solving complex problems step by step.It presents the decision-analysis process for both public and private decision-making, using different decision criteria, different types of information, and information of varying quality. It describes the elements in the analysis of decision alternatives and choices, as well as the goals and objectives that guide decision-making. The key issues related to a decision-maker’s preferences regarding alternatives, criteria for choice, and choice modes, together with the risk assessment tools are also presented.
Tags: intro IO
math videos for the world
Posted by Armando Brito Mendes | Filed under matemática, materiais ensino, videos

math videos for the world
PatrickJMT: making FREE and hopefully useful math videos for the world!
Tags: b-learning
Questionnaire Design
Posted by Armando Brito Mendes | Filed under estatística, materiais ensino

Arsham Questionaire Design
The contents of this site are aimed at students who need to perform basic statistical analyses on data from sample surveys, especially those in marketing science. Students are expected to have a basic knowledge of statistics, such as descriptive statistics and the concept of hypothesis testing.
Tags: inquéritos
Criar gráficos de Gantt no Excel
Posted by Armando Brito Mendes | Filed under Investigação Operacional, materiais ensino, visualização
rrphillips | 14 de junho de 2007 | 688 pessoa(s) gosta(m), 18 pessoa(s) não gosta(m)
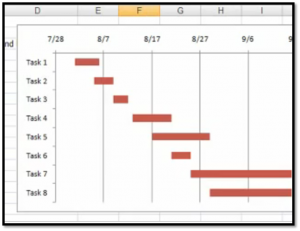
Using Excel 2007 to create a Gantt chart–a popular project management tool
Categoria: Guias e Estilo
- Demonstra como criar um gráfico de Gantt no Excel
- Demonstra como criar um gráfico de Gantt no Excel
Tags: Excel, programação em folha de cálculo
Tabelas de Dados no PASW Statistics
Posted by Armando Brito Mendes | Filed under estatística, materiais ensino
Tabelas de dados com o PASW Statistics
Tabelas de dados com o PASW Statistics
Criação de Base de Dados no PASW Statistics [HQ]
Tags: IBM SPSS Statistics
ANOVA com o PASW Statistics
Posted by Armando Brito Mendes | Filed under estatística, materiais ensino
ANOVA com PASW Statistics
ANOVA com PASW Statistics
ANOVA two-way com o PASW Statistics [HQ]
Tags: IBM SPSS Statistics
EXCEL Faults, Problems and Fixes
Posted by Armando Brito Mendes | Filed under Investigação Operacional, SAD - DSS

Excel faults

erros em folhas de cáclulo
Montes de erros e bugs identificados em versões mais antigas do Excel (até à 2007).
Ao programar modelos em Excel é necessário ter em conta estes pormenores.