Repositório de Dados da Universidade do Minho
Posted by Armando Brito Mendes | Filed under data sets
Um repositório de dados da Univ do Minho
Repositório de Dados da Universidade do Minho
Para partilhar, publicar e gerir dados de investigação.
Tags: dados investigação
Blooming Exploring Poverty in the Pacific Region
Posted by Armando Brito Mendes | Filed under visualização

Um gráfico diferente, não é um pictograma
How does the risk of living in poverty vary by gender, age and whether you live in an urban or rural area in a Pacific country?
A Data Visualization Project by Kristin Baumann
Tags: gráfico, pacífico, pobresa
Seeing How Much We Ate Over the Years
Posted by Armando Brito Mendes | Filed under Data Science, estatística, visualização
Bons gráficos de áreas acumuladas, a maior área passa para cima
By Nathan Yau
The United States Department of Agriculture keeps track of food availability for over 200 items, which can be used to estimate food consumption at the national level. They have data for 1970 through 2019, so we can for example, see how much beef Americans consume per year on average and how that has changed over four decades.
So that’s what I did.
How long will chicken reign supreme? Who wins between lemon and lime? Is nonfat ice cream really ice cream? Does grapefruit ever make a comeback? Find out in the charts below.
The rankings are broken into six main food groups: proteins, vegetables, fruits, dairy, grains, and added fats.
Tags: açucares, comida, gordura, gráfico de áreas, proteina
Failures to Act
Posted by Armando Brito Mendes | Filed under infogramas \ dashboards
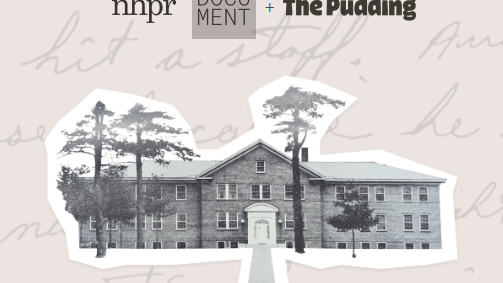
Uma excelente history telling com muitos testemunhos falados
Almost 1,300 people say New Hampshire failed to act to protect them from child abuse at youth facilities. Here’s what the allegations reveal.
By Jason Moon and Russell SamoraJune 26, 2024
Tags: história, sons, violência contra crianças
Calculating Empires
Posted by Armando Brito Mendes | Filed under materiais para profissionais, visualização
um mapa sobre a evolução tecnológica no tempo, muito completo
A Genealogy of Technology and Power Since 1500
Tags: história, mapa, tecnologia
The mysterious tyranny of trendy baby names
Posted by Armando Brito Mendes | Filed under infogramas \ dashboards, visualização

um estranho estudo sobre nomes de bebes mas com bons gráficos, especialmente de áreas
In America, how you spell your name says a lot about when you were born.
Take “Ashley,” for instance. Ashly, Ashley and Ashleigh each mark distinct eras — not just for the Ashleys of the world, but also for the various spellings themselves.
Tags: frequências, gráficos de áreas, nomes de beés, sons
WildChat
Posted by Armando Brito Mendes | Filed under data sets, LLMs

Um data set com um milhão de perguntas e respostas do chatGPT
The WildChat Dataset is a corpus of 1 million real-world user-ChatGPT interactions, characterized by a wide range of languages and a diversity of user prompts. It was constructed by offering free access to ChatGPT and GPT-4 in exchange for consensual chat history collection. Using this dataset, we finetuned Meta’s Llama-2 and created WildLlama-7b-user-assistant, a chatbot which is able to predict both user prompts and assistant responses.
To learn more: dataset / model / paper
Giant Batteries Are Transforming the Way the U.S. Uses Electricity
Posted by Armando Brito Mendes | Filed under Data Science, infogramas \ dashboards, visualização
Gráficos de áreas e gráficos de linhas muito bons. A Estória tb é interessante.
They’re delivering solar power after dark in California and helping to stabilize grids in other states. And the technology is expanding rapidly.
By Brad Plumer and Nadja Popovich May 7, 2024
Tags: area graph, baterias, energia, line graph
Where the Time Goes with Age
Posted by Armando Brito Mendes | Filed under infogramas \ dashboards, visualização
Bons gráficos de barras acumuladas
By Nathan Yau
We get 24 hours in a day. How do we spend this time? How does our time use change as we get older and priorities shift?
Here is the percentage breakdown in our teens, 20s, and 30s, through to our 80s.
Tags: gráficos de barras, idade, tempo
How Much We Work
Posted by Armando Brito Mendes | Filed under Data Science, visualização
Gráficos de alfinetes
By Nathan Yau
In our younger years, we have school and more important things to do, but then we get older and there are bills to pay. The charts below show the shift and the sweet release of retirement.