WEKA Cost Benefit Analysis
Posted by Armando Brito Mendes | Filed under SAD - DSS, software, visualização

Análise de custo benefício para avaliação de modelos
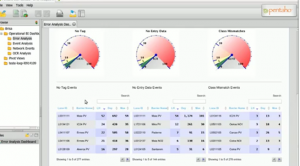
The Cost/Benefit analysis component is a new visualization tool that was released in Weka versions 3.6.2 and 3.7.1. The tool is particularly useful for the analysis of predictive analytic outcomes for direct mail campaigns (or any ranking application where costs are involved). It allows the user to explore various cost/benefit tradeoffs by interactively selecting different population sizes from the ranked list of prospects or by varying the threshold on the predicted probability of the positive class.
The Cost/Benefit analysis tool is available from both the Explorer and Knowledge Flow user interfaces. In the figure below, the Knowledge Flow is being used to build a predictive model for a real-world direct mail application. The data is historical campaign data from a mail out to solicit donations to a charitable organization. The data set contains 47,706 records with 476 variables (summary variables for donor lifetime giving history, overlay demographics etc.). The percentage of donors in the data is approximately 5%. A 10-fold cross-validation is used to generate predictions from a naive Bayes classifier, and these are then passed to the Cost/Benefit analysis tool.
Tags: data mining, WEKA
Global temperature rises over past century
Posted by Armando Brito Mendes | Filed under estatística, SAD - DSS, visualização
Boa visualização do aumento de temperaturas médias mundial
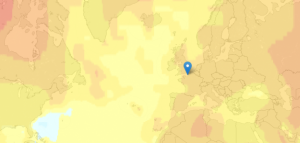
New Scientist mapped global temperature change based on a NASA GISTEMP analysis.
The graphs and maps all show changes relative to average temperatures for the three decades from 1951 to 1980, the earliest period for which there was sufficiently good coverage for comparison. This gives a consistent view of climate change across the globe. To put these numbers in context, the NASA team estimates that the global average temperature for the 1951-1980 baseline period was about 14 °C.
The more red an area the greater the increase was estimated to be, relative to estimates for 1951 to 1980 (especially noticeable in the Northern Hemisphere).
The most interesting part is when you compare all the way back to to the 19th century when it was much cooler. You can also click on locations for a time series of five-year averages.
Tags: análise de dados, data mining, Estat Descritiva
Creating Animations and Transitions With D3
Posted by Armando Brito Mendes | Filed under materiais para profissionais, SAD - DSS, visualização
Construção de visualizações de dados em java
In interactive visualisation, there is the word reactive. Well, maybe not literally, but close enough.
The fact is that reactivity, or the propension of a visualisation to respond to user actions, can really help engage the user in a visualisation, and help them understand its results. Both of which are usually good things. How can this reactivity be achieved? Through animations.
So I’ll go ahead and state that animation, if done right, can make any interactive data visualization better.
How is that?
- When coupled with interaction, it’s a very useful way to give feedback to the user. What has changed since their last command? If what’s on screen animates from one state to another, it’s obvious, it stands out and it makes sense. Or, when showing any form of real-time data, animation is pretty much required.
- Animation can bring focus on the important things as a chart loads. Our vision is very sensitive to movement, so using these introduction transitions sensibly helps a lot to ease the effort required to get the right information off a chart.
Tags: análise de dados, data mining, desnvolvimento de software
Data Mining for Business Intelligence
Posted by Armando Brito Mendes | Filed under materiais ensino, SAD - DSS
Livro completo no google books com boa introdução ao data mining
Índice
Tags: captura de conhecimento, data mining, Excel, programação em folha de cálculo, software estatístico
Novel Views: Les Miserables
Posted by Armando Brito Mendes | Filed under SAD - DSS, visualização

Visualizações de dados inovadoras baseadas em text mining
Jeff Clark took a detailed look at Victor Hugo’s Les Miserables via character mentions, word connections, and word usage. The above is character mentions with color showing sentiment. Red means negative, and blue positive.
Characters are listed from top to bottom in their order of appearance. The horizontal space is segmented into the 5 volumes of the novel. Each volume is subdivided further with a faint line indicating the various books and, finally, small rectangles indicate the chapters within the books. In the 5 volumes there are a total of 48 books and 365 chapters. The height of the small rectangles indicate how frequently that character is mentioned in that particular chapter.
There’s a good amount of blue towards the end, when everyone decides everyone else isn’t so bad.
Tags: captura de conhecimento, data mining, Estat Descritiva, text mining
Mathematical Programming in MathProg
Posted by Armando Brito Mendes | Filed under Investigação Operacional, SAD - DSS, software

Interface para resolução de probs PL ou MIP com java
GNU MathProg (part of the open source GNU GLPK project) is a modeling language for describing linear and discrete optimization problems. Use this page to create and solve MathProg models using the glpk.js solver. You can either open a model from your computer, select an example from the menu bar, or create your own from scratch. To use —
- Create a MathProg model in the Model Editor.
- Click ‘Solve’ to generate the solution.
- Click ‘Save As…’ to save the model locally to your computer.
Tags: otimização, software de otimização
XpandIT – Exemplos de BI
Posted by Armando Brito Mendes | Filed under materiais ensino, SAD - DSS, software
Bom vídeo de empresa pt com exemplos de BI
Tags: análise de dados, captura de conhecimento, data mining
Medical Algorithms
Posted by Armando Brito Mendes | Filed under SAD - DSS

Site com centenas de algoritmos usados em apoio à decisão médica
Medal.org Limited owns and operates the largest international web-based knowledge base of medical algorithms and computational procedures for medical treatment and administration. Medal.org is the largest provider of medical algorithms and the biggest player in the medical algorithms market, with a background of 5 years of building up its internet presence, book series, and professional sponsorship.
Tags: bioinformatica, decisão médica
History of Decision Support Systems
Posted by Armando Brito Mendes | Filed under SAD - DSS

History of Decision Support Systems
A Brief History of Decision Support Systems
version 4.1 by D. J. Power
Editor, DSSResources.COM
Tags: data mining
History of Spreadsheets
Posted by Armando Brito Mendes | Filed under Investigação Operacional, SAD - DSS
A Brief History of Spreadsheets
A Brief History of Spreadsheets
by D. J. Power
Editor, DSSResources.COM