SubMap 2.0: Ebulition
Posted by Armando Brito Mendes | Filed under videos, visualização
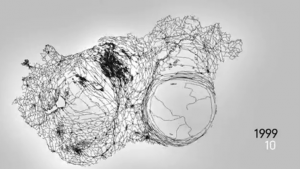
Ebullition visualises and sonificates data pulled from one of the biggest news sites of Hungary, origo.hu. In the 30 fps animation, each frame represents a single day, each second covers a month, starting from December 1998 until October 2010.
Whenever a Hungarian city or village is mentioned in any domestic news on origo.hu website, it is translated into a force that dynamically distorts the map of Hungary. The sound follows the visual outcome, creating a generative ever changing drone.
Tags: análise de dados
Comments are closed.
