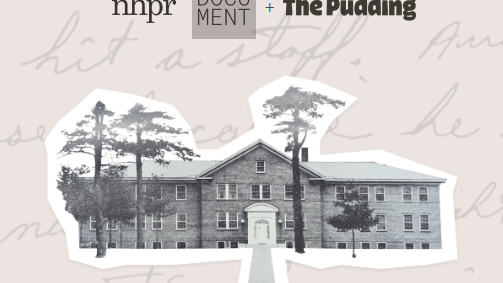
Failures to Act
Posted by Armando Brito Mendes | Filed under infogramas \ dashboards

Uma excelente history telling com muitos testemunhos falados
Almost 1,300 people say New Hampshire failed to act to protect them from child abuse at youth facilities. Here’s what the allegations reveal.
By Jason Moon and Russell SamoraJune 26, 2024
Tags: história, sons, violência contra crianças
Calculating Empires
Posted by Armando Brito Mendes | Filed under materiais para profissionais, visualização
um mapa sobre a evolução tecnológica no tempo, muito completo
A Genealogy of Technology and Power Since 1500
Tags: história, mapa, tecnologia
One million of us
Posted by Armando Brito Mendes | Filed under infogramas \ dashboards, relatórios, visualização
Uma história das mortes por COVID nos estados unidos ilustrada com gráficos unitários e de linhas acumuladas.
By Sergio Peçanha and Yan Wu Updated May 18 at 3:00 p.m.Originally published May 12, 2022651
The pandemic’s death toll in the United States has surpassed 1 million people. Conveying the meaning or the magnitude of this number is impossible. But 1 million deaths is the benchmark of an unprecedented American tragedy.
Consider this comparison: The population of D.C. is about 670,000 people. Try to imagine life without every person, in every building, on every street, in the nation’s capital. And then imagine another 330,000 people are gone.
To attempt to put the 1 million deaths in context, we plotted its damage over more than two years and compared the continuing death toll with the tolls from previous catastrophes in our history.
WILDFIRES AND FLOOD DAMAGE
Posted by Armando Brito Mendes | Filed under infogramas \ dashboards, mapas SIG's, relatórios, visualização
Um excelente relatório, muito dinâmico e com muitos mapas
Linking the devastating 2021 fires and floods in British Columbia
A Sparkgeo Story Map by Gordon Logie
2021 was a very damaging year for the Canadian province of British Columbia (BC), with the weather exacting a heavy toll. A record-breaking heat wave led into a severe wildfire season. Following these, an extreme winter rainfall event led to catastrophic flood damage which cascaded through the Canadian economy, disrupting major arteries for travel and trade.
Here at Sparkgeo, we are interested in the role that geospatial technology can play to help commercial organizations, municipalities, and the general public adapt to the challenges of a changing climate.
We believe that geospatial technologies can help not only to assess the damage from climate disasters, but also help reveal the underlying geographical factors which contribute to where and why damage occurs. This type of analysis may enable models to predict a particular location’s exposure to climate-related risk factors.
To explore this further, we present a research project examining linkages between the wildfires and subsequent flood damage in 2021
Tags: história, incêndios, inundações, mapas
