Excel formulas with comments
Posted by Armando Brito Mendes | Filed under Investigação Operacional, SAD - DSS

comments on Excel formulas
Takeaway: Need to share information about a formula with other users or developers? Drop them a note, right into the formula.
Tags: Excel, programação em folha de cálculo
ALEA – Acção Local Estatística Aplicada
Posted by Armando Brito Mendes | Filed under estatística, materiais ensino

O ALEA – Acção Local Estatística Aplicada – constitui-se no âmbito da Educação, da Sociedade da Informação, da Informação Estatística, da Formação para a Cidadania e da Literacia Estatística como um contributo para a elaboração e disponibilização de instrumentos de apoio ao ensino da Estatística para os alunos e professores do Ensino Básico e Secundário, tendo como principal suporte um sítio na web.
Tags: inferência
Delphi Decision Aid
Posted by Armando Brito Mendes | Filed under Investigação Operacional

delphi site
Delphi is a data-gathering tool to aid in the anonymous survey of expert judgments, obtained in a series of rounds, ultimately for forecasting purposes.
Tags: decisao em grupo, inquéritos, previsão
Bioconductor
Posted by Armando Brito Mendes | Filed under estatística
![]() Bioconductor provides tools for the analysis and comprehension of high-throughput genomic data. Bioconductor uses the R statistical programming language, and is open source and open development. It has two releases each year, more than 400 packages, and an active user community.
Bioconductor provides tools for the analysis and comprehension of high-throughput genomic data. Bioconductor uses the R statistical programming language, and is open source and open development. It has two releases each year, more than 400 packages, and an active user community.
Tags: bioinformatica, data mining
MC Genomics
Posted by Armando Brito Mendes | Filed under estatística
 BMC Genomics is an open access journal publishing original peer-reviewed research articles in all aspects of genome-scale analysis, functional genomics, and proteomics. BMC Genomics (ISSN 1471-2164) is indexed/tracked/covered by PubMed, MEDLINE, BIOSIS, CAS, EMBASE, Scopus, Zoological Record, CABI, Thomson Reuters (ISI) and Google Scholar.
Tags: bioinformatica, data mining
Hot Potatoes
Posted by Armando Brito Mendes | Filed under materiais ensino

Hot Potatoes é um conjunto de seis ferramentas de autoria, desenvolvidas pela equipe da University of Victoria CALL Laboratory Research and Development, que possibilitam a elaboração de seis tipos básicos de exercícios interactivos utilizando páginas Web.
Tags: b-learning, inquéritos
The Science of Better
Posted by Armando Brito Mendes | Filed under Investigação Operacional

what is O.R.?
In a nutshell, operational research (O.R.) is the discipline of applying advanced analytical methods to help make better decisions.
Tags: análise de sistemas, intro IO, otimização, problemas
wikipedia: investigação operacional
Posted by Armando Brito Mendes | Filed under Investigação Operacional
Operations research (also referred to as decision science, or management science) is an interdisciplinary mathematical science that focuses on the effective use of technology by organizations. In contrast, many other science & engineering disciplines focus on technology giving secondary considerations to its use.
A Investigação Operacional (IO) ou Pesquisa operacional (PO), é um ramo interdisciplinar da matemática aplicada que faz uso de modelos matemáticos, estatísticos e de algoritmos na ajuda à tomada de decisões. É usada sobretudo para analisar sistemas complexos do mundo real, tipicamente com o objectivo de melhorar ou optimizar a performance.
As redes podem explodir
Posted by Armando Brito Mendes | Filed under ARS - SNA, visualização
Scientists from the Max Planck Institute for Dynamics and Self-Organization discover how the size of networks can skyrocket
A single new connection can dramatically enhance the size of a network – no matter whether this connection represents an additional link in the Internet, a new acquaintance within a circle of friends or a connection between two nerve cells in the brain.
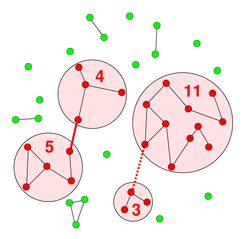
novas ligações fazem explodir a dimensão das redes
Tags: ARS\SNA intro
NodeXL: Suplemento do Excel openSource para SNA
Posted by Armando Brito Mendes | Filed under ARS - SNA, visualização
Add-in do Excel para Análise de Redes Sociais (SNA)
Do you need to display and analyze a network graph but you don’t want to deal with difficult applications, arcane file formats, or advanced programming languages? NodeXL may be what you’re looking for.
Tags: ARS\SNA intro, grafos