noticias, textos e tudo o mais sobre big data
Posted by Armando Brito Mendes | Filed under materiais para profissionais

muito material interessante sobre big data
Tags: big data, data mining, DW \ BI
8 Mistakes Our Brains Make
Posted by Armando Brito Mendes | Filed under ADM - multicritério, materiais para profissionais

A tomada de decisão intuitiva cai frequentemente em armadilhas
1. We surround ourselves with information that matches our beliefs
2. We believe in the “swimmer’s body” illusion
3. We worry about things we’ve already lost
4. We incorrectly predict odds
5. We rationalize purchases we don’t want
6. We make decisions based on the anchoring effect
7. We believe our memories more than facts
8. We pay more attention to stereotypes than we think
Tags: decisao em grupo
processos do PMBOK 5
Posted by Armando Brito Mendes | Filed under materiais para profissionais, planeamento
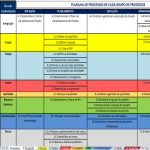
Folha de cálculo com todos os processos sugeridos pelo PMBOK v5
dicasgp.pmtech.com.br
Nova versão da planilha com as entradas e saídas detalhadas dos 47 processos do Guia PMBOK® 5a Ed.
Tags: gestão de projetos
Habilidades essenciais do Gerente de Projetos
Posted by Armando Brito Mendes | Filed under materiais para profissionais, planeamento

Bons conselhos para gestores de projetos
Confira quais as principais características que o gerente de projetos tem que ter para se sair bem nesse papel
Por ser uma área relativamente nova na cultura empresarial brasileira e na área educacional, a gestão de projetos é um papel assumido por profissionais com formações diversas. Tem gerente de projetos engenheiro, administrador, publicitário, arquiteto, analista de sistemas, entre outras graduações. Mas qual é a verdadeira formação essencial ao Gerente de Projetos?
Tags: gestão de projetos
planear não é pilotar o Project
Posted by Armando Brito Mendes | Filed under materiais para profissionais, planeamento

Interessante texto sobre o q significa planear
Planejar não é pilotar o Project (ou qualquer outro software de planejamento)… atualmente há diversos softwares de planejamento, com diferentes níveis de detalhes e possibilidades. Aprender a utilizar estes softwares não é tão difícil (pelo menos o básico), porém é preciso entender que estes softwares são uma ferramenta de planejamento, não são O Planejamento.
Tags: gestão de projetos, qualidade
Excel: Esconder valores duplicados
Posted by Armando Brito Mendes | Filed under materiais para profissionais, software

Tip para esconder valores repetidos usando formatação condicional
Duplicate values aren’t wrong or bad, but they can be distracting. You probably won’t want to delete them, but you might just want to hide them. For example, the simple sheet below repeats date values in column A. In a reporting scenario, those duplicate dates might be annoying.
Tags: Excel, programação em folha de cálculo
Rattle: A Graphical User Interface for Data Mining using R
Posted by Armando Brito Mendes | Filed under estatística, materiais ensino, materiais para profissionais, software
 Rattle (the R Analytical Tool To Learn Easily) presents statistical and visual summaries of data, transforms data into forms that can be readily modelled, builds both unsupervised and supervised models from the data, presents the performance of models graphically, and scores new datasets.
Tags: data mining, R-software, software estatístico, text mining
visualizing.org
Posted by Armando Brito Mendes | Filed under materiais para profissionais, visualização

Blog sobre visualização onde pode publicar o seu trabalho
A community of creative people
making sense of complex issues
through data and design — join us
Visualizations Explore the best in data visualization and infographics created by our community
Visualizations Upload, host, and showcase your work under CC license
Open Data Find and discuss new data sets from NGO’s, governments and other sources, curated by Visualizing
Data Channels Engage with the scientists behind the data sets on Visualizing and explore related visualizations uploaded by our community
Visualizing Player Take advantage of the first-ever player for data visualization and infographics. Embed away!
Challenges Sharpen your skills and win unique prizes by entering our data visualization challenges
Visualizing Marathons A one-of-a-kind global series of 24-hour student data viz competitions
Partners Visualizing collaborates with a wide range of Academic, Knowledge, and Media Partners
Tags: belo, Estat Descritiva
Data-Driven Documents D3.js
Posted by Armando Brito Mendes | Filed under materiais para profissionais, software, visualização
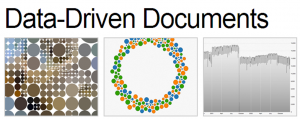
Uma biblioteca java para construir visualizações de dados
D3.js is a JavaScript library for manipulating documents based on data. D3 helps you bring data to life using HTML, SVG and CSS. D3’s emphasis on web standards gives you the full capabilities of modern browsers without tying yourself to a proprietary framework, combining powerful visualization components and a data-driven approach to DOM manipulation.
Download the latest version here:
Or, to link directly to the latest release, copy this snippet:
<script src="http://d3js.org/d3.v3.min.js" charset="utf-8"></script>The full source and tests are also available for download on GitHub.
Tags: belo, desnvolvimento de software
Dictionary of Numbers
Posted by Armando Brito Mendes | Filed under estatística, matemática, materiais para profissionais
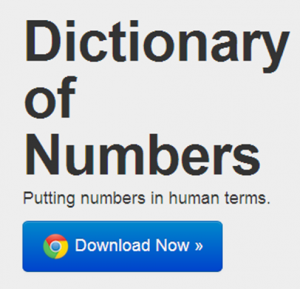
um dicionário q associa factos a números
is an award-winning Google Chrome extension that tries to make sense of numbers you encounter on the web by giving you a description of that number in human terms. Like a dictionary describes words you don’t know in terms you do, Dictionary of Numbers puts quantities you’re unfamiliar with in terms you can understand. Because “8 million people” means nothing, but “population of New York City” means everything.
Tags: belo, Estat Descritiva, problemas