European Commissioner for the Digital Agenda Neelie Kroes Speeches
Posted by Armando Brito Mendes | Filed under materiais para profissionais

Os discursos da Neelie seguem as tendências do mercado, pelo q se fala muito em analytics, big data, etc.
Politicians’ speeches are important for shaping the policy debate, but they are too often designed as one-way messages.
We want to open up conversations around them, by making speeches commentable phrase by phrase.
Where best to start than from the European Commissioner for the Digital Agenda, Neelie Kroes?
So just select a speech below and click on the phrases that you want to comment.
Tags: análise de sistemas, modelos empresariais
ontologies and data models
Posted by Armando Brito Mendes | Filed under materiais para profissionais, SAD - DSS
Já se perguntaram qual a diferença entre ontologias e modelos de dados?
Ontologies versus Data Models
Data models have been with us since Ted Codd described normalization in 1970 and Peter Chen published his paper on entity relationship diagrams in 1976. Ontology as a discipline in philosophy can trace its roots to ancient Greece. As applied to data management, it is much more recent than data modeling and has only appeared in the past few years. But just what is the difference between ontologies and data models? If they are both about data, do they not boil down to the same thing?
Tags: captura de conhecimento, data mining
A Programmer’s Guide to Data Mining
Posted by Armando Brito Mendes | Filed under estatística, materiais para profissionais

Um livro on-line com alguns dos métodos de data mining
A guide to practical data mining, collective intelligence, and building recommendation systems by Ron Zacharski.
About This Book
Before you is a tool for learning basic data mining techniques. Most data mining textbooks focus on providing a theoretical foundation for data mining, and as result, may seem notoriously difficult to understand. Don’t get me wrong, the information in those books is extremely important. However, if you are a programmer interested in learning a bit about data mining you might be interested in a beginner’s hands-on guide as a first step. That’s what this book provides.
This guide follows a learn-by-doing approach. Instead of passively reading the book, I encourage you to work through the exercises and experiment with the Python code I provide. I hope you will be actively involved in trying out and programming data mining techniques. The textbook is laid out as a series of small steps that build on each other until, by the time you complete the book, you have laid the foundation for understanding data mining techniques. This book is available for download for free under a Creative Commons license (see link in footer). You are free to share the book, and remix it. Someday I may offer a paper copy, but the online version will always be free.
Table of Contents
This book’s contents are freely available as PDF files. When you click on a chapter title below, you will be taken to a webpage for that chapter. The page contains links for a PDF of that chapter and for any sample Python code and data that chapter requires. Please let me know if you see an error in the book, if some part of the book is confusing, or if you have some other comment. I will use these to revise the chapters.
Chapter 1: Introduction
Finding out what data mining is and what problems it solves. What will you be able to do when you finish this book.
Chapter 2: Get Started with Recommendation Systems
Introduction to social filtering. Basic distance measures including Manhattan distance, Euclidean distance, and Minkowski distance. Pearson Correlation Coefficient. Implementing a basic algorithm in Python.
Chapter 3: Implicit ratings and item-based filtering
A discussion of the types of user ratings we can use. Users can explicitly give ratings (thumbs up, thumbs down, 5 stars, or whatever) or they can rate products implicitly–if they buy an mp3 from Amazon, we can view that purchase as a ‘like’ rating.
Chapter 4: Classification
In previous chapters we used people’s ratings of products to make recommendations. Now we turn to using attributes of the products themselves to make recommendations. This approach is used by Pandora among others.
Chapter 5: Further Explorations in Classification
A discussion on how to evaluate classifiers including 10-fold cross-validation, leave-one-out, and the Kappa statistic. The k Nearest Neighbor algorithm is also introduced.
Chapter 6: Naïve Bayes
An exploration of Naïve Bayes classification methods. Dealing with numerical data using probability density functions.
Chapter 7: Naïve Bayes and unstructured text
This chapter explores how we can use Naïve Bayes to classify unstructured text. Can we classify twitter posts about a movie as to whether the post was a positive review or a negative one?
Chapter 8: Clustering
Clustering – both hierarchical and kmeans clustering.
Tags: data mining, previsão
Humor com gráficos kindofnormal
Posted by Armando Brito Mendes | Filed under estatística, materiais ensino, materiais para profissionais, visualização

Humor com esquemas e gráficos
Alguns exemplos:
-

- June 12, 2014
- 0
-

- June 11, 2014
- 3.8
-

- June 10, 2014
- 5.9
-

- June 9, 2014
- 5
-

- June 6, 2014
- 5.5
-

Tags: belo, Estat Descritiva
Better data centers through machine learning
Posted by Armando Brito Mendes | Filed under materiais para profissionais
Exemplo de aplicação de algoritmos de aprendizagem automática
It’s no secret that we’re obsessed with saving energy. For over a decade we’ve been designing and building data centers that use half the energy of a typical data center, and we’re always looking for ways to reduce our energy use even further. In our pursuit of extreme efficiency, we’ve hit upon a new tool: machine learning. Today we’re releasing a white paper (PDF) on how we’re using neural networks to optimize data center operations and drive our energy use to new lows.
Tags: análise de dados, data mining, previsão
BEAKER The data scientist’s laboratory
Posted by Armando Brito Mendes | Filed under materiais para profissionais, software
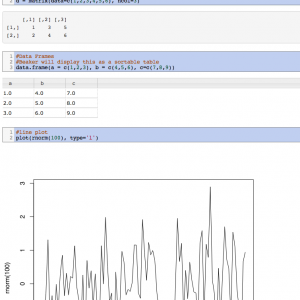
Um ambiente de programação q aceita várias linguagens
Beaker is a code notebook that allows you to analyze, visualize, and document data using multiple programming languages including Python, R, Groovy, Julia, and Node. Beaker’s plugin-based polyglot architecture enables you to seamlessly switch between languages and add support for new languages.
Tags: data mining, desnvolvimento de software, R-software
Why use R? Five reasons
Posted by Armando Brito Mendes | Filed under materiais para profissionais, software
Bom blogue, as principais razões para usar R
Why use R? Five reasons.
In this post I will go through 5 reasons: zero cost, crazy popularity, awesome power, dazzling flexibility, and mind-blowing support. I believe R is the best statistical programming language to learn. As a blogger who has contributed over 150 posts in Stata and over 100 in R I have extensive experience with both a proprietary statistical programming language as well as the open source alternative. In my graduate career I have also had the opportunity to experiment with the proprietary software SPSS, SAS, Mathematica, as well as MPlus.
Tags: big data, definição, R-software, software estatístico
9 “must read” articles on Big Data
Posted by Armando Brito Mendes | Filed under estatística, materiais para profissionais, visualização
Textos para big data
My selection
- Big Data – From Descriptive to Prescriptive
- Can big data be racist?
- NodeXL Graph Gallery: Graph Details
- Best Metrics For Digital Marketing: Rock Your Own And Rent Strategies
- Big Data: from mining to meaning
- Beautiful versus useful visualizations (in French, but interesting)
- Learning and Teaching Machine Learning: A Personal Journey
- Big data techniques and technologies
- The Sexiest Job of the 21st Century is Tedious, and that Needs to C… (*)
- From the trenches: 360-degree data science
(*) I disagree with this Harvard Business Review author. Senior data scientists work on high level data from various sources, use automated processes for EDA (exploratory analysis) and spend little to no time in tedious, routine, mundane tasks (less than 5% of my time, in my case). I also use robust techniques that work well on relatively dirty data, and … I create and design the data myself in many cases.
Tags: belo, big data, data mining, Estat Descritiva, grafos
SPSS Macros on the Internet
Posted by Armando Brito Mendes | Filed under estatística, materiais para profissionais, software

Alguns sites com macros para SPSS
What sources of SPSS macros are available on the Internet?
Here are a few that I know about; I hope other people will tell us about ones that should be listed but aren’t.
An obvious starting point is SPSS Inc’s own Macro Library at http://www.spss.com/tech/stat/macros/ (it doesn’t contain very many, though, and they are statistical rather than utilities). If you are planning to adapt or write macros, it’s also worth seeing what’s in SPSS Inc’s AnswerNet Solutions. Go to http://www.spss.com/tech/answer/, specify Product; SPSS Base and Free Text: macro, then click on the page’s Search button.Raynald Levesque’s site http://pages.infinit.net/rlevesqu/ includes many pages on macros (including examples and some tutorial materials). But you should also look at the examples in his pages on syntax, as some of these are based on macros.
Newsgroups are also a useful source of macros. Searches of their archives can be very rewarding if you can get your search terms right (see our Other Internet Resources page).
Confidence intervals for proportions, differences between proportions and related quantities. See Dr Robert G. Newcombe’s home page at http://www.uwcm.ac.uk/uwcm/ms/Robert.html. Note that these are SPSS programs rather than macros, despite being described as macros by the author.
Polytomous logistic regression (of particular interest to users of SPSS 8.0 and earlier). For macros by John Hendrickx and Prof. Dr. Steffen Kühnel see http://www.sls.wau.nl/bk/bedrijfskunde/jhendrickx/spss/mlogist/
Regression: evaluating collinearity in models with interactions or non-linear terms. For a macro by Ben Pelzer, Manfred te Grotenhuis, Jan Lammers, John Hendrickx, see http://www.sls.wau.nl/bk/bedrijfskunde/jhendrickx/spss/perturb/perturb.html
Tags: Estat Descritiva, IBM SPSS Statistics, inferência, software estatístico
Read Histograms and Use Them in R
Posted by Armando Brito Mendes | Filed under estatística, materiais para profissionais, visualização
Bom tutorial para construir histogramas no R
How to Read Histograms and Use Them in R
The histogram is one of my favorite chart types, and for analysis purposes, I probably use them the most. Devised by Karl Pearson (the father of mathematical statistics) in the late 1800s, it’s simple geometrically, robust, and allows you to see the distribution of a dataset.
If you don’t understand what’s driving the chart though, it can be confusing, which is probably why you don’t see it often in general publications.
Tags: análise de dados, data mining, Estat Descritiva, R-software, software estatístico