How to: network animation with R and the iGraph
Posted by Armando Brito Mendes | Filed under ARS - SNA, software
This article lists the steps I take to create a network animation in R, provides some example source code that you can copy and modify for your own work, and starts a discussion about programming and visualization as an interpretive approach in research. Before I start, take a look at this network animation created with R and the iGraph package. This animation is of a retweet network related to #BankTransferDay. Links (displayed as lines) are retweets, nodes (displayed as points) are user accounts. For each designated period of time (in this case, an hour), retweets are drawn and then fade out over 24 hours.
Tags: captura de conhecimento, data mining, grafos, R-software
Atlas of Science
Posted by Armando Brito Mendes | Filed under ARS - SNA, visualização
Introduction
Overview, promotion, and how to order.
Images
Access references and download high resolution images
References
Search all references and download in fielded format
Author
About the author
History
History of the Atlas
Awards
Awards for Atlas of Science
Questions & Answers
You ask, the author answers.
Vendors & Events
Where to buy
Libraries
Where to borrow
Press
What others have been saying
Stanford Large Network Dataset Collection
Posted by Armando Brito Mendes | Filed under ARS - SNA, data sets
- Social networks: online social networks, edges represent interactions between people
- Communication networks: email communication networks with edges representing communication
- Citation networks: nodes represent papers, edges represent citations
- Collaboration networks: nodes represent scientists, edges represent collaborations (co-authoring a paper)
- Web graphs: nodes represent webpages and edges are hyperlinks
- Amazon networks : nodes represent products and edges link commonly co-purchased products
- Internet networks : nodes represent computers and edges communication
- Road networks : nodes represent intersections and edges roads connecting the intersections
- Autonomous systems : graphs of the internet
- Signed networks : networks with positive and negative edges (friend/foe, trust/distrust)
- Wikipedia networks and metadata : Talk, editing and voting data from Wikipedia
- Twitter and Memetracker : Memetracker phrases, links and 467 million Tweets
Tags: análise de dados, ARS\SNA intro, grafos
Mapping Breivik’s Mind
Posted by Armando Brito Mendes | Filed under ARS - SNA, visualização
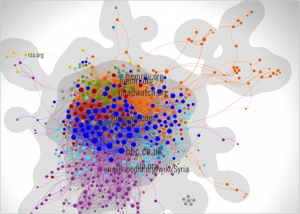
The man behind the Norway bombings and shootings wrote a link-filled manifesto. To show the vast spread of websites he cites, and how they linked to each other, we turned to French visualisers Linkfluence
Tags: ARS\SNA intro, captura de conhecimento, grafos
VideoLectures.Net
Posted by Armando Brito Mendes | Filed under estatística, Investigação Operacional, matemática, materiais ensino
VideoLectures.NET is a free and open access educational video lectures repository. The lectures are given by distinguished scholars and scientists at the most important and prominent events like conferences, summer schools, workshops and science promotional events from many fields of Science. All lectures, accompanying documents, information and links are systematically selected and classified through the editorial process taking into account also users’ comments.
Tags: data mining, grafos, inferência, inquéritos, intro IO, otimização, previsão, problemas
LucidChart: Esquemas na Web
Posted by Armando Brito Mendes | Filed under visualização
From static wireframes to rapid prototypes, web developers can do it all with LucidChart. Collaborate with your client and design team in real-time to cut down on iterations.
Tags: captura de conhecimento, grafos
Fuzzy Cognitive Maps
Posted by Armando Brito Mendes | Filed under Investigação Operacional, visualização
I thought that fuzzy cognitive maps are a very interesting idea that may have some potential. I was curious to try and see whether I had grasped the concept and could come up with a fuzzy cognitive map that provides information about a system. Since programming is understanding, I thought that the best way to ensure that I had understood something was to write a program to draw and run fuzzy cognitive maps. I programmed an applet that you can find here. After that, I wrote some tutorials and then the rest of this web site. The last addition has been the forum.
Home | Tutorials | Software| Library | Links | Disclaimer | Contact
Tags: captura de conhecimento, data mining, grafos, mapas
Using Concept Maps
Posted by Armando Brito Mendes | Filed under Investigação Operacional, visualização
As part of the project, a collaborative software system was developed called the Knowledge Soup (Cañas et al 1996), which allows students from distant schools to share claims (propositions) derived from their concept maps regarding any domain of knowledge being studied.
Tags: captura de conhecimento, data mining, decisao em grupo, grafos
Concept Mapping: Informal to Formal
Posted by Armando Brito Mendes | Filed under Investigação Operacional, visualização
Concept mapping techniques, both formal and informal, are useful in knowledge representation, decision support, education, documentation, meeting support, brainstorming, and a host of other areas.
Tags: captura de conhecimento, data mining, grafos, mapas
Cognitive Mapping: Definitions, Examples, and Resources
Posted by Armando Brito Mendes | Filed under Investigação Operacional, visualização
- Definition of Cognitive Mapping
- History and Use of the Term
 Examples of cognitive maps
 - The Process of Cognitive Mapping
- Different Types of Cognitive Map
and Mapping Techniques
 Causal mapping
 - Definition of a Concept Map
 Examples of concept maps
 - Theory and Use of Concept Maps
- The Medicine Wheel as a Concept Map
- Semantic Mapping
 Examples of semantic maps
 - Semantic Web
- Visual Schemata
- Wayfinding — Which Way Is Up?
- Intrapsychic cognitive maps
- History and Use of the Term
- Left Sidebar
- Right Sidebar —
References & Resources
Tags: captura de conhecimento, data mining, grafos, mapas


