8 Mistakes Our Brains Make
Posted by Armando Brito Mendes | Filed under ADM - multicritério, materiais para profissionais

A tomada de decisão intuitiva cai frequentemente em armadilhas
1. We surround ourselves with information that matches our beliefs
2. We believe in the “swimmer’s body” illusion
3. We worry about things we’ve already lost
4. We incorrectly predict odds
5. We rationalize purchases we don’t want
6. We make decisions based on the anchoring effect
7. We believe our memories more than facts
8. We pay more attention to stereotypes than we think
Tags: decisao em grupo
blog: Notícias de Gestão de Projetos
Posted by Armando Brito Mendes | Filed under planeamento

Um bom blog sobre gestão de projetos
Tags: gestão de projetos
Engineer solves Big Data Conjecture
Posted by Armando Brito Mendes | Filed under Investigação Operacional, matemática

Um problema de combinatória em contexto de big-data
IBM Distinguished Engineer solves Big Data Conjecture
A mathematical problem related to big data was solved by Jean-Francois Puget, engineer in the Solutions Analytics and Optimization group at IBM France. The problem was first mentioned on Data Science Central, and an award was offered to the first data scientist to solve it.
Bryan Gorman, Principal Physicist, Chief Scientist at Johns Hopkins University Applied Physics Laboratory, made a significant breakthrough in July, and won $500. Jean-Francois Puget completely solved the problem, independently from Bryan, and won a $1,000 award.
Tags: big data, data mining, otimização
4 Faces of Big Data
Posted by Armando Brito Mendes | Filed under estatística
Bom texto sobre os vários aspetos a considerar no Big-Data
The 4 Faces of Big Data Challenges You just Can’t Ignore
Tags: análise de dados, big data, data mining
processos do PMBOK 5
Posted by Armando Brito Mendes | Filed under materiais para profissionais, planeamento
Folha de cálculo com todos os processos sugeridos pelo PMBOK v5
dicasgp.pmtech.com.br
Nova versão da planilha com as entradas e saídas detalhadas dos 47 processos do Guia PMBOK® 5a Ed.
Tags: gestão de projetos
Habilidades essenciais do Gerente de Projetos
Posted by Armando Brito Mendes | Filed under materiais para profissionais, planeamento

Bons conselhos para gestores de projetos
Confira quais as principais características que o gerente de projetos tem que ter para se sair bem nesse papel
Por ser uma área relativamente nova na cultura empresarial brasileira e na área educacional, a gestão de projetos é um papel assumido por profissionais com formações diversas. Tem gerente de projetos engenheiro, administrador, publicitário, arquiteto, analista de sistemas, entre outras graduações. Mas qual é a verdadeira formação essencial ao Gerente de Projetos?
Tags: gestão de projetos
Resultados do census de 2011
Posted by Armando Brito Mendes | Filed under data sets
Resultados do censos de 2011
A maior fonte de informação nacional sobre a população, a família e a habitação.
Aceda aos Resultados Definitivos:
Tags: Estat Descritiva, inquéritos
Paddy – design a multi-stage survey
Posted by Armando Brito Mendes | Filed under estatística, materiais ensino, software

Jogo sério para desenho de inquéritos
This game is a rice survey based on an actual survey carried out in Sri Lanka. In a small district there are 10 villages with a total of 160 farmers who each have one field in which to grow rice. A census of the area has been undertaken and the acreage cultivated by each farmer is known. There is now to be a crop cuttin survey whose main aim is to estimate the mean yield of rice per acre and hence the total production of rice in the district. The survey will also be used to investigate the use of fertilisers and the different varieties of rice used in the district.
The resources available allow for 30 plots to be sampled. The plots to be harvested are 1/80 acre but the yields are recorded in bushels per acre. Students use a multistage sampling scheme. For example:
- Select x villages
- From each village choose y fields
- Select z plots from each field
The game consists of 10 boxes each containing a number of envelopes, which themselves contain a number of slips of paper. The boxes represent a village so students select the boxes corresponding to their chosen villages. They open the boxes and select the envelopes labelled with their chosen field number. Information on the size of the field, the variety of rice used and the amount of fertiliser applied is also displayed on the envelope label. Finally, they select the slip of paper labelled with their chosen plot number and record the yield.
Tags: Estat Descritiva, inquéritos, software estatístico
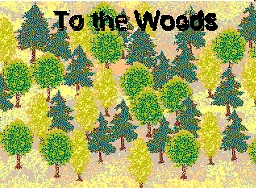
To the Woods – a detailed comparison of Sampling methods
Posted by Armando Brito Mendes | Filed under estatística, materiais ensino, software
Simulação para aprender amostragem simples e estratificada
To the Woods – a detailed comparison of Simple Random Sampling and Stratified Sampling
In this game the aim is to conduct a small survey to estimate the total number of trees in a forest and the proportion of large trees. A tree is considered ‘large’ if its diameter at breast height (DBH) is greater than 30cm. The area of forest from which the sample is to be taken is divided into two regions (‘East’ and ‘West’) by a river. Within each region it is possible to count the number of trees in any 50m x 50m plot. There are 168 plots in total – 96 to the West of the river and 72 to the East.
There are two alternative sampling solutions. Students take a sample of 14 plots and can either use simple random sampling or stratified sampling to choose them. They record the number of small trees, the number of large trees and the total number of trees for each of the 14 observations.
The game consists of 168 small pieces of card, which represent the plots, slipped into slits in a large piece of card representing the forest. A river can be drawn on the large piece of card to divide the forest into two regions. One side is labelled ‘West’ and the other ‘East’. The protruding sections of the plots are labelled with their region side (West or East) and plot number (1 to 96 and 1 to 72, respectively). The student pulls out the chosen plots and records the numbers of large and small trees, which is printed on the lower section of the plot.
Tags: Estat Descritiva, software estatístico
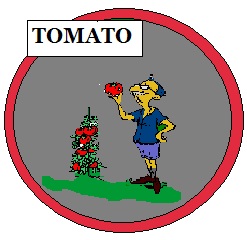
Tomato – jogo para aprender plano experimental
Posted by Armando Brito Mendes | Filed under estatística, materiais ensino
Software de simulação para perceber o desenho experimental
Tomato – a game to help understand the issues involved in experimental design
Tomato simulates an experiment to test the effect of different factors on the yield of tomatoes grown in a greenhouse. Students simulate the conduct of an experiment starting from the discussion of the appropriate design up to the conclusions. There are three factors (variety, heat, light), each at two levels (Coward/Doger, Standard/Supplementary, Standard/Supplementary). Students have to allocate the eight treatments to the 12 plots in the greenhouse. They are asked to take account of the different sides (North/South) of the greenhouse when allocating the treatments, which introduces a blocking factor. A second blocking factor, year, has also been built into the model; the experiment can be run over two years, resulting in two seasons of the crop. The players can decide which treatments to apply in the first year and use the results to determine which treatments to apply in the second year. Alternatively, they may choose to design the scheme for both years at the start. This means that the game incorporates blocking and the possibility of using unbalanced designs. It also introduces the factorial structure of the treatments.