Daily Routine, 2020
Posted by Armando Brito Mendes | Filed under Data Science, relatórios, visualização
Bom exemplo de relatório com gráficos de áreas.
By Nathan Yau
After looking at how much time we spent on daily activities in 2020, let’s look at when we spent our time. Based on data from the American Time Use Survey, the chart below shows the percentage of people doing activities on a non-holiday weekday.
What The New Census Data Shows About Race Depends On How You Look At It
Posted by Armando Brito Mendes | Filed under Data Science, relatórios, visualização
Bom exemplo de relatório com gráficos unitários
Over the past decade, the United States continued to grow more racially and ethnically diverse, according to the results of last year’s national head count that the U.S. Census Bureau released this week.
There are many ways to slice the data and change how the demographic snapshot looks.
Since the 2000 count, participants have been able to check off more than one box when answering the race question on census forms. But breakdowns of the country’s racial and ethnic makeup often don’t reflect a multiracial population that has increased by 276% since the 2010 census. They focus instead on racial groups that are made up of people who marked only one box, with multiracial people sometimes lumped together in a catchall group.
A new way to visualize the surge in Covid-19 cases in the U.S.
Posted by Armando Brito Mendes | Filed under Data Science, relatórios, visualização

Bom relatório com muitos exemplos de gráficos de linhas
The month of July has seen Covid-19 cases in the United States increase at the fastest pace since last winter, marking the start of the latest wave of infections to afflict the nation. A new STAT analysis of Covid-19 case data reveals this new wave is already outpacing the spring and summer waves of 2020.
There are many metrics that governments, scientists, and media outlets have used to try and reckon with the Covid-19 pandemic. One of the most popular ways of visualizing Covid data has been to track the weekly average of new cases. This is pictured below.
Tags: COVID, gráficos de linhas, graphs
How Much the Everyday Changes When You Are in a Pandemic
Posted by Armando Brito Mendes | Filed under Data Science, estatística, relatórios, visualização
Um gráfico inovador para mostrar a evolução entre dois pontos no tempo
A comparison of American time use in 2020 versus 2019By Nathan Yau
Our everyday routines changed over the past year, and with the recent data release from the 2020 American Time Use Survey, we can see by how much.
The survey, published by the Bureau of Labor Statistics, asks participants what they did over a 24-hour period. Usually, the survey is ongoing with results published each year, but in 2020, it was suspended from mid-March to mid-May.
Tags: alteração do modo de vida, COVID, tempo
Counting Happiness and Where it Comes From
Posted by Armando Brito Mendes | Filed under Data Science, visualização
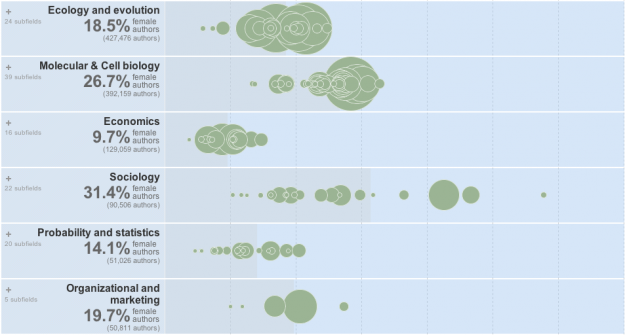
Um excelente exemplo de gráfico de bolhas ligadas
Researchers asked 10,000 participants to list ten things that recently made them happy. The result was HappyDB, a collection of 100,000 happy moments. For each moment, I parsed out the subject, verb, and object to better see what makes people happy overall.
For example, someone might have said “I watched a good movie yesterday.” The subject was “I”, the verb was “watched”, and the object was “movie”.
Then I counted and connected the dots.
Tags: bolhas, gráficos, happiness
Vaccination burnout?
Posted by Armando Brito Mendes | Filed under Data Science, relatórios, visualização

Muito bom relatório com gráficos originais e alguns interativos sobre a evolução da vacinação COVID-19
The pace of COVID-19 vaccinations is increasing in a handful of spots around the globe as the more contagious Delta variant spreads and governments expand their efforts to try to reach more people.
In Israel the vaccination rate had plateaued in April as new COVID infections were on a months-long steady decline. But when the arrival of Delta brought a spike of cases in June, the government jumped in quickly with a new campaign urging teenagers to get the shot and parents to vaccinate their children aged 12 to 15.
Tags: COVID, difference charts, gráficos
UEFA 2020 chart gallery
Posted by Armando Brito Mendes | Filed under Data Science, infogramas \ dashboards, visualização

Uma foram curiosa, usando triângulos (centrais para o resultado e laterais para os penaltis) de visualizar os resultados do europeu.
these charts were inspired by Basketball Tower Charts (Andrew Garcia Phillips, Chartball.com)
Tags: futebol, triângulos
Republicans Fall Short in Voting-Rights Crackdown While Adding Hassle at Polls
Posted by Armando Brito Mendes | Filed under Data Science, materiais para profissionais, relatórios, visualização

Bom relatório sobre a produção de legislação nos EUA com gráficos muito originais.
A nationwide move by Republicans to tighten voting rules in the wake of Donald Trump’s defeat has largely fizzled into a few additional hassles for voters in the next elections, far short of the sweeping changes described by both the GOP and Democratic critics.
In the name of election security, Republican lawmakers passed dozens of new voting restrictions this year, adding hurdles to mail-in voting, reducing local control over elections and targeting innovations used by large urban counties during the coronavirus pandemic, even as Democratic-led states focused on making voting easier.
Tags: gráficos, legislação, visualização
America’s top hospitals hound patients
Posted by Armando Brito Mendes | Filed under Data Science, infogramas \ dashboards, relatórios, visualização

A new analysis reveals that many of the top hospitals in America pursue patients with lawsuits and other predatory billing practices
bom relatório com representações de dados dinâmicas e imaginativas
By Michelle McGhee and Will ChaseIn partnership with Johns Hopkins University
In February 2018, Stephen Swett went to the emergency room at Westchester Medical Center in New York seeking help for withdrawal from Suboxone, which treats opioid addiction. Swett — a 44-year old truck driver — says he sat on a gurney until he was discharged. Then in June of last year, the hospital filed a court summons, the beginning of its attempt to collect the $2,539.43 it said Swett owed for his trip.
- “I went there, and it was my responsibility for going there. But at the same time, you don’t even take my temperature, you don’t do anything, you just basically let me sit, and then you stick me with a bill and take me to court,” Swett said. “That’s what I didn’t feel was right.”
The big picture: Rising deductibles and out-of-pocket costs are increasingly leaving patients responsible for bloated medical bills. A new analysis by Johns Hopkins University reveals that many of the top 100 hospitals by revenue in the U.S. use predatory tactics to pursue patients with unpaid bills.
How Severe Is the Western Drought?
Posted by Armando Brito Mendes | Filed under Data Science, relatórios, visualização

bom relatório sobre as secas nos EUA
An intense drought is gripping the American West. Extreme conditions are more widespread than at any point in at least 20 years, according to the U.S. Drought Monitor, the government’s official drought-tracking service.
And the hottest months of summer are still to come.