Probability and Monte Carlo methods
Posted by Armando Brito Mendes | Filed under estatística, Habilitações Académicas, matemática, materiais ensino

Um bom texto de introdução à probabilidade e simulação de Monte-Carlo
This is a lecture post for my students in the CUNY MS Data Analytics program. In this series of lectures I discuss mathematical concepts from different perspectives. The goal is to ask questions and challenge standard ways of thinking about what are generally considered basic concepts. I also emphasize using programming to help gain insight into mathematics. Consequently these lectures will not always be as rigorous as they could be.
Tags
monte carlo, numerical integration, probability, simulation
Tags: Estat Descritiva, R-software, software estatístico
Machine Learning
Posted by Armando Brito Mendes | Filed under materiais ensino, videos
Um bom curso video de machine learning
About the Course
Course Syllabus
Tags: data mining, DW \ BI
Machine Learning MOOC
Posted by Armando Brito Mendes | Filed under estatística, materiais ensino, videos
Um curso muito completo de machine learning
About the Course
Machine learning is the science of getting computers to act without being explicitly programmed. In the past decade, machine learning has given us self-driving cars, practical speech recognition, effective web search, and a vastly improved understanding of the human genome. Machine learning is so pervasive today that you probably use it dozens of times a day without knowing it. Many researchers also think it is the best way to make progress towards human-level AI. In this class, you will learn about the most effective machine learning techniques, and gain practice implementing them and getting them to work for yourself. More importantly, you’ll learn about not only the theoretical underpinnings of learning, but also gain the practical know-how needed to quickly and powerfully apply these techniques to new problems. Finally, you’ll learn about some of Silicon Valley’s best practices in innovation as it pertains to machine learning and AI.
This course provides a broad introduction to machine learning, datamining, and statistical pattern recognition. Topics include: (i) Supervised learning (parametric/non-parametric algorithms, support vector machines, kernels, neural networks). (ii) Unsupervised learning (clustering, dimensionality reduction, recommender systems, deep learning). (iii) Best practices in machine learning (bias/variance theory; innovation process in machine learning and AI). The course will also draw from numerous case studies and applications, so that you’ll also learn how to apply learning algorithms to building smart robots (perception, control), text understanding (web search, anti-spam), computer vision, medical informatics, audio, database mining, and other areas.
FAQ
- What is the format of the class?The class will consist of lecture videos, which are broken into small chunks, usually between eight and twelve minutes each. Some of these may contain integrated quiz questions. There will also be standalone quizzes that are not part of video lectures, and programming assignments.
- How much programming background is needed for the course?The course includes programming assignments and some programming background will be helpful.
- Do I need to buy a textbook for the course?No, it is self-contained.
- Will I get a statement of accomplishment after completing this class?Yes. Students who successfully complete the class will receive a statement of accomplishment signed by the instructor.
Tags: big data, bioinformatica, captura de conhecimento, data mining, DW \ BI
Data Mining with Weka MOOC
Posted by Armando Brito Mendes | Filed under Habilitações Académicas, materiais ensino, software, videos

Um curso em vídeo sobre a utilização do WEKA para data mining
Welcome to the free online course Data Mining with Weka
This 5 week MOOC introduced data mining concepts through practical experience with the free Weka tool.
The course featured:
- video lectures by Professor Ian H. Witten
- the open-source Weka data mining platform
- access to chapters from Data Mining (3rd Edition)
- discounts from Morgan Kaufmann
- online assessment leading to a statement of completion
The course will run again in early March 2014. To get notified about dates (enrolment, commencement), please subscribe to the announcement forum.
You can access the course material (videos, slides, etc) from here.
Tags: data mining, software estatístico, WEKA
Paddy – design a multi-stage survey
Posted by Armando Brito Mendes | Filed under estatística, materiais ensino, software

Jogo sério para desenho de inquéritos
This game is a rice survey based on an actual survey carried out in Sri Lanka. In a small district there are 10 villages with a total of 160 farmers who each have one field in which to grow rice. A census of the area has been undertaken and the acreage cultivated by each farmer is known. There is now to be a crop cuttin survey whose main aim is to estimate the mean yield of rice per acre and hence the total production of rice in the district. The survey will also be used to investigate the use of fertilisers and the different varieties of rice used in the district.
The resources available allow for 30 plots to be sampled. The plots to be harvested are 1/80 acre but the yields are recorded in bushels per acre. Students use a multistage sampling scheme. For example:
- Select x villages
- From each village choose y fields
- Select z plots from each field
The game consists of 10 boxes each containing a number of envelopes, which themselves contain a number of slips of paper. The boxes represent a village so students select the boxes corresponding to their chosen villages. They open the boxes and select the envelopes labelled with their chosen field number. Information on the size of the field, the variety of rice used and the amount of fertiliser applied is also displayed on the envelope label. Finally, they select the slip of paper labelled with their chosen plot number and record the yield.
Tags: Estat Descritiva, inquéritos, software estatístico
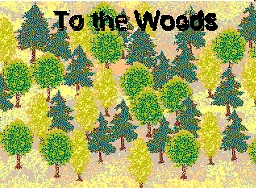
To the Woods – a detailed comparison of Sampling methods
Posted by Armando Brito Mendes | Filed under estatística, materiais ensino, software
Simulação para aprender amostragem simples e estratificada
To the Woods – a detailed comparison of Simple Random Sampling and Stratified Sampling
In this game the aim is to conduct a small survey to estimate the total number of trees in a forest and the proportion of large trees. A tree is considered ‘large’ if its diameter at breast height (DBH) is greater than 30cm. The area of forest from which the sample is to be taken is divided into two regions (‘East’ and ‘West’) by a river. Within each region it is possible to count the number of trees in any 50m x 50m plot. There are 168 plots in total – 96 to the West of the river and 72 to the East.
There are two alternative sampling solutions. Students take a sample of 14 plots and can either use simple random sampling or stratified sampling to choose them. They record the number of small trees, the number of large trees and the total number of trees for each of the 14 observations.
The game consists of 168 small pieces of card, which represent the plots, slipped into slits in a large piece of card representing the forest. A river can be drawn on the large piece of card to divide the forest into two regions. One side is labelled ‘West’ and the other ‘East’. The protruding sections of the plots are labelled with their region side (West or East) and plot number (1 to 96 and 1 to 72, respectively). The student pulls out the chosen plots and records the numbers of large and small trees, which is printed on the lower section of the plot.
Tags: Estat Descritiva, software estatístico
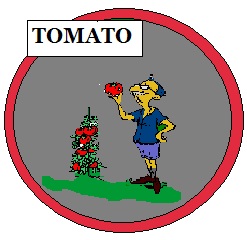
Tomato – jogo para aprender plano experimental
Posted by Armando Brito Mendes | Filed under estatística, materiais ensino
Software de simulação para perceber o desenho experimental
Tomato – a game to help understand the issues involved in experimental design
Tomato simulates an experiment to test the effect of different factors on the yield of tomatoes grown in a greenhouse. Students simulate the conduct of an experiment starting from the discussion of the appropriate design up to the conclusions. There are three factors (variety, heat, light), each at two levels (Coward/Doger, Standard/Supplementary, Standard/Supplementary). Students have to allocate the eight treatments to the 12 plots in the greenhouse. They are asked to take account of the different sides (North/South) of the greenhouse when allocating the treatments, which introduces a blocking factor. A second blocking factor, year, has also been built into the model; the experiment can be run over two years, resulting in two seasons of the crop. The players can decide which treatments to apply in the first year and use the results to determine which treatments to apply in the second year. Alternatively, they may choose to design the scheme for both years at the start. This means that the game incorporates blocking and the possibility of using unbalanced designs. It also introduces the factorial structure of the treatments.
Tags: Estat Descritiva, software estatístico
Rattle: A Graphical User Interface for Data Mining using R
Posted by Armando Brito Mendes | Filed under estatística, materiais ensino, materiais para profissionais, software
 Rattle (the R Analytical Tool To Learn Easily) presents statistical and visual summaries of data, transforms data into forms that can be readily modelled, builds both unsupervised and supervised models from the data, presents the performance of models graphically, and scores new datasets.
Tags: data mining, R-software, software estatístico, text mining
Handbook of Statistical Analysis and Data Mining Applications
Posted by Armando Brito Mendes | Filed under estatística, materiais ensino, visualização
Livro completo no google books com as ligações entre a estatística e o DM
Índice
| 1 | |
| 119 | |
| 363 | |
| 705 | |
| 789 | |
| 801 | |
| 823 | |
Tags: captura de conhecimento, data mining, text mining
Data Mining for Business Intelligence
Posted by Armando Brito Mendes | Filed under materiais ensino, SAD - DSS
Livro completo no google books com boa introdução ao data mining
Índice
Tags: captura de conhecimento, data mining, Excel, programação em folha de cálculo, software estatístico