S-PLUS & R Class Links
Posted by Armando Brito Mendes | Filed under estatística, materiais ensino, materiais para profissionais, software
clicar na imagem para seguir o link
montes de materiais para R e S-PLUS.
S-PLUS & R Class Links
Instructor: Richard Herrington
Why Do We Care To Use the “S” Language? Does anyone care besides us? The Association for Computing Machinery (ACM) cares
S-Plus
- Introduction to S language (S-Plus, R)
- S-Plus Windows Notes (MASS – Brian Ripley)
- S-Plus 6 Users Guide
- S-Plus 6 Users Guide to “Introduction to the Practice of Statistics”
- Datasets for “Introduction to the Practice of Statistics”
- S-Plus Tutorial
- S-Plus Website
- S-Plus Official Documentation
S-PLUS Student Edition Download (Free)
- Student Edition 6.2 – This version of S-Plus has a 20,000 cell or 1,000 row limitation; is only for educational use; is good for only one year; and is a rather large download (100+ meg).
S-PLUS Free Experimental Libraries and User Contributed Libraries
- Research Libraries – Includes: S+CorrelatedData (mixed effects generalized linear models), S+Best (B-Spline methods), S+Resample (bootstrap library), S+Bayes (bayesian analysis), S+FDA (functional data analysis).
- User Contributed Libraries
Tinn-R Script Editor
- SourceForge Download Site – Download Tinn-R Setup Files; Tinn-R can serve as a script editor and “pager” for R Console. See Tinn-R Convenient Script Editor for R on Win32 Platform
R
Download Site for the Current Windows Install Binary and R Packages
- Main CRAN Website
- CRAN Windows Binary – Installer for Win32 (also available for MacOS X and Linux
- CRAN R Package Descriptions – Pdf manuals available for packages
- R Packages Organized by Topic – Organized by discipline and methodology
Web Interfaces to R Web Servers and Example R Scripts
- R Web Interfaces – Web/browser based interfaces to R script processing on a server
- Example R Scripts – Some of these scripts run on a server and results are communicated thru a web browser
- RSS Rweb Server – Link to http:/rss.acs.unt.edu R server
R, R(D)COM and Excel
- Introduction to R – ppt
- Using R with Excel – A (D)COM Server for the Windows Platform – Benchmarks article (needs updating badly – Rich)
- R(D)COM Server Homepage – Thomas Baier
- R(D)COM Listserve Archive
- Download for single install file – R-2.4.1, R(D)COM and RExcel only
- Download for single install file – R-2.4.1 – use this file for a comprehensive install of selectable components: R, Rcmdr, R(D)COM, RExcel, rcom, gobbi, Rgobbi, and Tinn-R. R Version 2.5.0 combined install found here.
- Installing The R(D)COM server – Help Pages
- Using The R(D)COM server – Help Pages
- Using R Within Excel – Help Pages
- Duncan Temple Lang’s R (D)COM Homepage
- Duncan Temple Lang’s R (D)COM Notes
- Duncan Temple Lang’s R (D)COM Client examples– directory listing
- Duncan Temple Lang’s R (D)COM Server – examples listing
- General Computing Considerations
Tags: Excel, R-software, software estatístico
Rtips. Revival 2014!
Posted by Armando Brito Mendes | Filed under estatística, matemática, software

Uma animação com todos os lugares referidos numa canção de johnny cash
Montes de exemplos de R numa única longa página.
Tags: análise de dados, Estat Descritiva, inferência, R-software, software estatístico
CRAN Task Views
Posted by Armando Brito Mendes | Filed under estatística, visualização

clique na imagem para seguir o link
Uma lista de temas com uma descrição dos principais pacotes R ligados ao tema
CRAN Task Views
| Bayesian | Bayesian Inference |
| ChemPhys | Chemometrics and Computational Physics |
| ClinicalTrials | Clinical Trial Design, Monitoring, and Analysis |
| Cluster | Cluster Analysis & Finite Mixture Models |
| DifferentialEquations | Differential Equations |
| Distributions | Probability Distributions |
| Econometrics | Econometrics |
| Environmetrics | Analysis of Ecological and Environmental Data |
| ExperimentalDesign | Design of Experiments (DoE) & Analysis of Experimental Data |
| Finance | Empirical Finance |
| Genetics | Statistical Genetics |
| Graphics | Graphic Displays & Dynamic Graphics & Graphic Devices & Visualization |
| HighPerformanceComputing | High-Performance and Parallel Computing with R |
| MachineLearning | Machine Learning & Statistical Learning |
| MedicalImaging | Medical Image Analysis |
| MetaAnalysis | Meta-Analysis |
| Multivariate | Multivariate Statistics |
| NaturalLanguageProcessing | Natural Language Processing |
| NumericalMathematics | Numerical Mathematics |
| OfficialStatistics | Official Statistics & Survey Methodology |
| Optimization | Optimization and Mathematical Programming |
| Pharmacokinetics | Analysis of Pharmacokinetic Data |
| Phylogenetics | Phylogenetics, Especially Comparative Methods |
| Psychometrics | Psychometric Models and Methods |
| ReproducibleResearch | Reproducible Research |
| Robust | Robust Statistical Methods |
| SocialSciences | Statistics for the Social Sciences |
| Spatial | Analysis of Spatial Data |
| SpatioTemporal | Handling and Analyzing Spatio-Temporal Data |
| Survival | Survival Analysis |
| TimeSeries | Time Series Analysis |
| WebTechnologies | Web Technologies and Services |
| gR | gRaphical Models in R |
To automatically install these views, the ctv package needs to be installed, e.g., via
install.packages("ctv")
library("ctv")
and then the views can be installed via install.views or update.views (which first assesses which of the packages are already installed and up-to-date), e.g.,
install.views("Econometrics")
or
update.views("Econometrics")
Tags: data mining, R-software, software estatístico
Montes de recursos sobre R
Posted by Armando Brito Mendes | Filed under estatística, materiais ensino, software

clique na imagem para abrir o link
Muitos recursos para o R que vão de exemplos introdutórios até ao multivariado.
|
Do it yourself Introduction to R R is a free statistical programming language environment. It is completely free to anyone — like the air you breath is free. For more information on why everyone should be using R, see here. |
|
|---|---|
|
The goal of this site is to allow someone to overcome the intimidation associated with learning the very basics of R and showing them the tools for continued usage. Let’s get started. Some assumptions: This site assumes you are using a Windows operating system and have a basic understanding of file structures and paths. You will also need to have administrator privileges in order to install R. Some of the notes linked on this page are standard HTML pages; most of the links on this page are in R script file format (they have the file extension.R). Beyond that; the site and any instructions or links on it should be self-explanatory. It is STRONGLY recommended that one progress through the modules in order. A brief explanation of this page is here. UPDATE NOTE: April 23, 2015: current R version is 3.2.0 These pages have been tested for use with Firefox, other browsers may display the pages incorrectly. |
Tags: análise de dados, data mining, Estat Descritiva, R-software, software estatístico
Using Open Source in Higher Education: R Tutorials
Posted by Armando Brito Mendes | Filed under estatística, software
clique na imagem para seguir o link
Alguns bons tutoriais para aprender mais.
Recent Posts
- R Tutorial: A Simple Script to Create and Analyze a Data File, Part Two
- Book Review: R High Performance Programming
- R Tutorial: A Script to Create and Analyze a Simple Data File, Part One
- Nonparametric Statistical Analysis Using R: The Sign Test
- Book Review: Mastering Beaglebone Robotics
Recent Comments
| R Tutorial: A Script… on R Tutorial: A Script to Create… | |
| Rees Morrison on Using R for Basic Cross Tabula… |
Archives
Categories
Tags: análise de dados, R-software, software estatístico
An Example of R Versatility
Posted by Armando Brito Mendes | Filed under estatística, software
clicar na imagem para seguir o link

An Example of R Versatility
By Dave Collingridge
In my last blog post I mentioned a few advantages to learning R. One of those advantages is that R opens up a world of new data analyses. There are novel techniques available in R that are not found in the ANALYZE drop down menus of SPSS, Stata, and Statistica. Novel techniques in R can be a big help in situations where data are not well-suited for traditional analyses like t-tests, ANOVA, and regression.
Tags: data mining, R-software
Base R Version
Posted by Armando Brito Mendes | Filed under estatística, materiais ensino, software, visualização
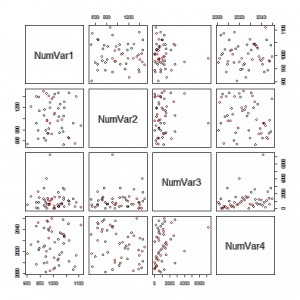
clicar na imagem para seguir o link
Excelentes exemplos de gráficos que podem usar nos trabalhos.
One Variable: Numeric Variable
One Variable: Factor Variable
Two Variables: Two Numeric Variables
Two Variables: Two Factor Variables
Two Variables: One Factor and One Numeric
Three Variables: Three Factor Variables
Three Variables: One Numeric and Two Factor Variables
Three Variables: Two Numeric and One Factor Variables
Three Variables: Three Numeric Variables
Scatterplot Matrix of all Numeric Vars, colored by a Factor variable
Tags: Estat Descritiva, R-software, software estatístico
The beautiful R charts in London: The Information Capital
Posted by Armando Brito Mendes | Filed under visualização
clique na figura para seguir o link
Um bom exemplo de utilização de gráficos do R em ilustração.
If you’ve lived in or simply love London, a wonderful new book for your coffee-table is London: The Information Capital. In 100 beautifully-rendered charts, the book explores the data that underlies the city and its residents. To create most of these charts, geographer James Cheshire and designer Oliver Uberti relied on programs written in R. Using the R programming language not only created beautiful results, it saved time: “a couple of lines of code in R saved a day of manually drawing lines”.
Tags: belo, mapas, R-software
Moving Past Default Charts
Posted by Armando Brito Mendes | Filed under estatística, visualização
clicar na imagem para seguir o link
Um excelente tutorial para aprender a trabalhar com os parâmetros dos gráficos em R.
Tags: belo, data mining, R-software, software estatístico
Using Open Source Technology in Higher Education
Posted by Armando Brito Mendes | Filed under estatística, software
Um blogue com muitos posts sobre a utilização do R
Using R for Basic Cross Tabulation Analysis: Part Three, Using the xtabs Function
crosstabsrr programmingr statisticstable analysis
Using R to Work with GSS Survey Data: Cross Tabulation Tables
chi squaredcross tablescrosstabsrr programmingr statisticstable analysis
R Tutorial: Using R to Work With Datasets From the NORC General Social Science Survey
create csv filefile conversionrr programmingr statisticsr tutorialread spss filesresearch
How to Set Up SSH to Remotely Control Your Raspberry Pi
mmand lineraspberry piraspberry pi computingRaspberry Pi Software Configuationremote access with sshset up sshsshterminal program
Tags: análise de dados, data mining, desnvolvimento de software, Estat Descritiva, R-software, software estatístico