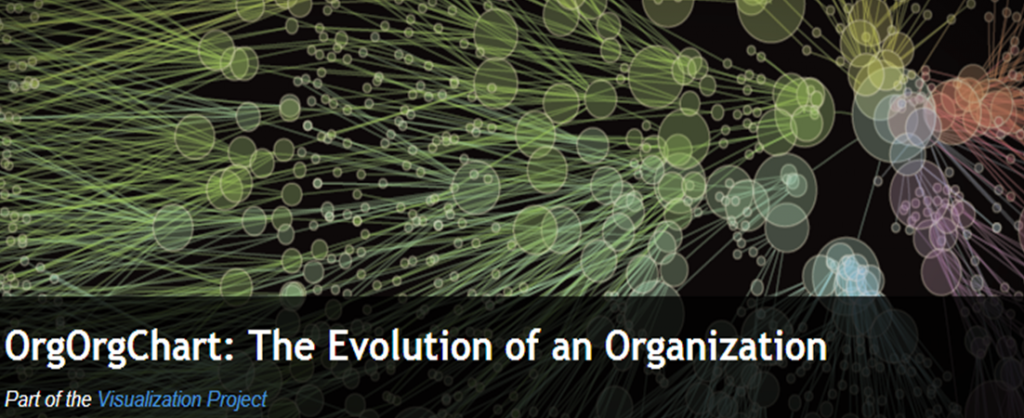
Unstable Ground
Posted by Armando Brito Mendes | Filed under Data Science, infogramas \ dashboards, relatórios, visualização
Um excelente relatório cheio de mapas interativos muito bem conseguidos
The Arctic is changing, but what does that mean for the north and the rest of the planet?
The Arctic is warming more than twice as fast as the global average.
Climate change is transforming the Arctic, impacting people and ecosystems across this vast region. But because our climate system is connected globally, what happens in the Arctic doesn’t stay in the Arctic.
Discover how Arctic landscapes are changing and learn about the consequences for communities across the globe.
Tags: alterações climáticas, ártico, belo, Estat Descritiva, mapas
Age and Occupation
Posted by Armando Brito Mendes | Filed under Data Science, estatística, visualização

Um bom gráfico interativo de intervalos de confiança de idades, um para cada emprego
By Nathan Yau
Whether it’s because of experience, physical ability, or education level, some jobs tend towards a certain age of worker more than others. For example, fast food counter workers tend to be younger, whereas school bus drivers tend to be older.
These are the age ranges for 529 jobs. Search for your job or look at others.
Tags: análise de dados, belo, empregos, Estat Descritiva, idades
How Men and Women Spend Their Days
Posted by Armando Brito Mendes | Filed under Data Science, estatística, relatórios, visualização
Um bom exemplo de gráficos de linhas acumuladas ou gráfico de diferenças
By Nathan Yau
For the employed, unemployed, and those not in the labor force, the charts below show the percentage of people doing an activity over a day in 2020. Switch between a weekday or a weekend day. Select activities to see individually.
Tags: análise de dados, belo, Estat Descritiva, homens e mulheres, ocupação
The pandemic marks another grim milestone: 1 in 500 Americans have died of covid-19
Posted by Armando Brito Mendes | Filed under estatística, relatórios, visualização
Um bom exemplo da utilização de valores relativos em vez de valores absolutos
By Dan Keating, Akilah Johnson and Monica Ulmanu Updated Sept. 15 at 9:00 a.m.Originally published Sept. 15, 20210
At a certain point, it was no longer a matter of if the United States would reach the gruesome milestone of 1 in 500 people dying of covid-19, but a matter of when. A year? Maybe 15 months? The answer: 19 months.
Given the mortality rate from covid and our nation’s population size, “we’re kind of where we predicted we would be with completely uncontrolled spread of infection,” said Jeffrey D. Klausner, clinical professor of medicine, population and public health sciences at the University of Southern California’s Keck School of Medicine. “Remember at the very beginning, which we don’t hear about anymore, it was all about flatten the curve.”
Tags: covid-19, Estat Descritiva, EUA
Best Data Science Learning podcasts
Posted by Armando Brito Mendes | Filed under lições, materiais ensino, materiais para profissionais, videos

Muito bons podcasts tem temas introdutórios
We present the top 12 Data Science & Machine Learning related Podcasts by popularity on iTunes. Check out latest episodes to stay up-to-date & become a part of the data conversations!
By Bhavya Geethika Peddibhotla.
Learn Data science the new way by listening to these compelling story tellers, interviewers, educators and experts in the field. Data suggests that podcasting about Data Science is only growing!
Tags: análise de dados, big data, data mining, desnvolvimento de software, Estat Descritiva, machine learning
Raynald’s SPSS Tools
Posted by Armando Brito Mendes | Filed under estatística, materiais para profissionais, software
![]()
Bons recursos sobre SPSS e ligação com R e Pyton
Raynald’s SPSS Tools
The collection of syntaxes, macros, scripts and hints for better solutions of data management and data analysis problems in IBM SPSS Statistics
Tags: análise de dados, decisão médica, Estat Descritiva, IBM SPSS Statistics, R-software, software estatístico
Straightforward Statistics Videos
Posted by Armando Brito Mendes | Filed under estatística, lições, materiais ensino, videos
clique na imagem para seguir o link
Montes de vídeos sobre todos os temas abordados em P&E
Video and Multimedia
Click on the following links. Please note these will open in a new window.
Descriptive Versus Inferential Statistics
https://www.youtube.com/watch?v=edEXEyvG4Wk
Illustrates the differential purposes served by descriptive and inferential techniques in conducting statistical analyses.
https://www.youtube.com/watch?v=L6hy1CY-OW4
Practical examples of descriptive and inferential statistics
https://www.youtube.com/watch?v=be9e-Q-jC-0
Simple Random Sampling, Convenience Sampling, Systematic Sampling, Cluster Sampling, Stratified Sampling
Types of Variables
https://www.youtube.com/watch?v=hZxnzfnt5v8
Describes the concepts of; a) unit of observation and b) variables and consequently the differences amongst the three major levels of measurement of variables, nominal, ordinal and interval/ratio.
Tags: análise de dados, Estat Descritiva
INTRODUCTORY STATISTICS book
Posted by Armando Brito Mendes | Filed under estatística, lições, materiais ensino

clique na imagem para seguir o link
Um webBook sobre estatística com exercícios e exemplos em SPSS
INTRODUCTORY STATISTICS:
CONCEPTS, MODELS, AND APPLICATIONS
3rd Web Edition
David W. Stockburger
Missouri State University
@Copyright 2013 by David W. Stockburger
Tags: Estat Descritiva, IBM SPSS Statistics, inferência
Research Methods Knowledge Base
Posted by Armando Brito Mendes | Filed under estatística, materiais ensino, materiais para profissionais

Um webBook pensado para investigadores sobre temas de estatística
What is the Research Methods Knowledge Base?
The Research Methods Knowledge Base is a comprehensive web-based textbook that addresses all of the topics in a typical introductory undergraduate or graduate course in social research methods. It covers the entire research process including: formulating research questions; sampling (probability and nonprobability); measurement (surveys, scaling, qualitative, unobtrusive); research design (experimental and quasi-experimental); data analysis; and, writing the research paper. It also addresses the major theoretical and philosophical underpinnings of research including: the idea of validity in research; reliability of measures; and ethics. The Knowledge Base was designed to be different from the many typical commercially-available research methods texts. It uses an informal, conversational style to engage both the newcomer and the more experienced student of research. It is a fully hyperlinked text that can be integrated easily into an existing course structure or used as a sourcebook for the experienced researcher who simply wants to browse.
- Home
- Table of Contents
- Navigating
- Foundations
- Sampling
- Measurement
- Design
- Analysis
- Write-Up
- Appendices
- Search
Tags: análise de dados, b-learning, Estat Descritiva, inferência
A New View of Statistics
Posted by Armando Brito Mendes | Filed under estatística, lições, materiais ensino

Um webBook com montes de temas bem explicados
Mar 2013. Coming very soon: a slideshow and Excel workbook for an introductory course of 10 lectures on statistics. Aug 2011. Check out the following 2010 articles at Sportscience: assigning subjects to treatments in a controlled trial; regression vs limits of agreement in measure-comparison studies; magnitudes of effects derived from linear models. See the frame at right for links to much more, including the progressive statistics and research design articles. Previous updates…
New original approaches to statistics for researchers: the examples are taken from exercise and sport science, but the principles apply to all empirical sciences. Read more in the preface.
Feedback wanted: if you can’t understand something here, it’s my fault. Email me.
Become a license holder…eventually! Not yet. More…
Full Contents
Short Contents:
Preface: About These Pages
Summarizing Data
Simple Statistics & Effect Statistics
Dimension Reduction
Precision of Measurement
Generalizing to a Population
Confidence Limits & Statistical Significance
Statistical Models
Estimating Sample Size
Summary: The Most Important Points
Quiz
Reference: Hopkins, W. G. (2000). A new view of statistics. Internet Society for Sport Science: http://www.sportsci.org/resource/stats/.
Tags: análise de dados, Estat Descritiva, inferência, previsão