Devoured
Posted by Armando Brito Mendes | Filed under mapas SIG's, materiais para profissionais, relatórios, visualização
Excelente relatório com mapas dinâmicos muito bons
How China’s largest freshwater lake was decimated by sand mining.
By Simon Scarr & Manas Sharma
PUBLISHED JULY 19, 2021
Decades of mass urbanisation in China have fuelled rampant demand for sand to make glass, concrete and other materials used in construction. The most desirable sand for this industry comes from rivers and lakes rather than deserts and oceans. Much of the sand used to build the country’s megacities has come from Poyang Lake, in the eastern province of Jiangxi.
Already ravaged by sand mining, the lake now faces a biodiversity crisis. At the start of this year, the provincial government revived a project to alleviate drought by regulating water flows between the Yangtze River and Poyang Lake with a 3 km-long sluice gate.
Chinese conservationist Zhang Daqian criticized the planned structure, saying it would cut the lake off from the river, “leaving Poyang a dead lake”.
The shallow lake, a national nature reserve, is also a rest stop for over 300 species of migratory birds, including the critically endangered Siberian crane. It is home to the endangered Yangtze River or finless porpoise, a short-snouted dolphin-like creature known for its ‘smile’ but of which there are only around 1,000 individuals left.
Tags: ambiente, belo, mapas, minas
Repulsive Curves
Posted by Armando Brito Mendes | Filed under materiais para profissionais, refs bibliográficas, visualização

Um trabalho muito interessante e com muito código sobre os melhores algoritmos para construir curvas que não se sobrepõem
Curves play a fundamental role across computer graphics, physical simulation, and mathematical visualization, yet most tools for curve design do nothing to prevent crossings or self-intersections. This paper develops efficient algorithms for (self-)repulsion of plane and space curves that are well-suited to problems in computational design. Our starting point is the so-called tangent-point energy, which provides an infinite barrier to self-intersection. In contrast to local collision detection strategies used in, e.g., physical simulation, this energy considers interactions between all pairs of points, and is hence useful for global shape optimization: local minima tend to be aesthetically pleasing, physically valid, and nicely distributed in space. A reformulation of gradient descent, based on a Sobolev-Slobodeckij inner product enables us to make rapid progress toward local minima—independent of curve resolution. We also develop a hierarchical multigrid scheme that significantly reduces the per-step cost of optimization. The energy is easily integrated with a variety of constraints and penalties (e.g., inextensibility, or obstacle avoidance), which we use for applications including curve packing, knot untangling, graph embedding, non-crossing spline interpolation, flow visualization, and robotic path planning.
Data Visualization In Excel Using Python
Posted by Armando Brito Mendes | Filed under estatística, lições, materiais ensino, materiais para profissionais, SAD - DSS, software
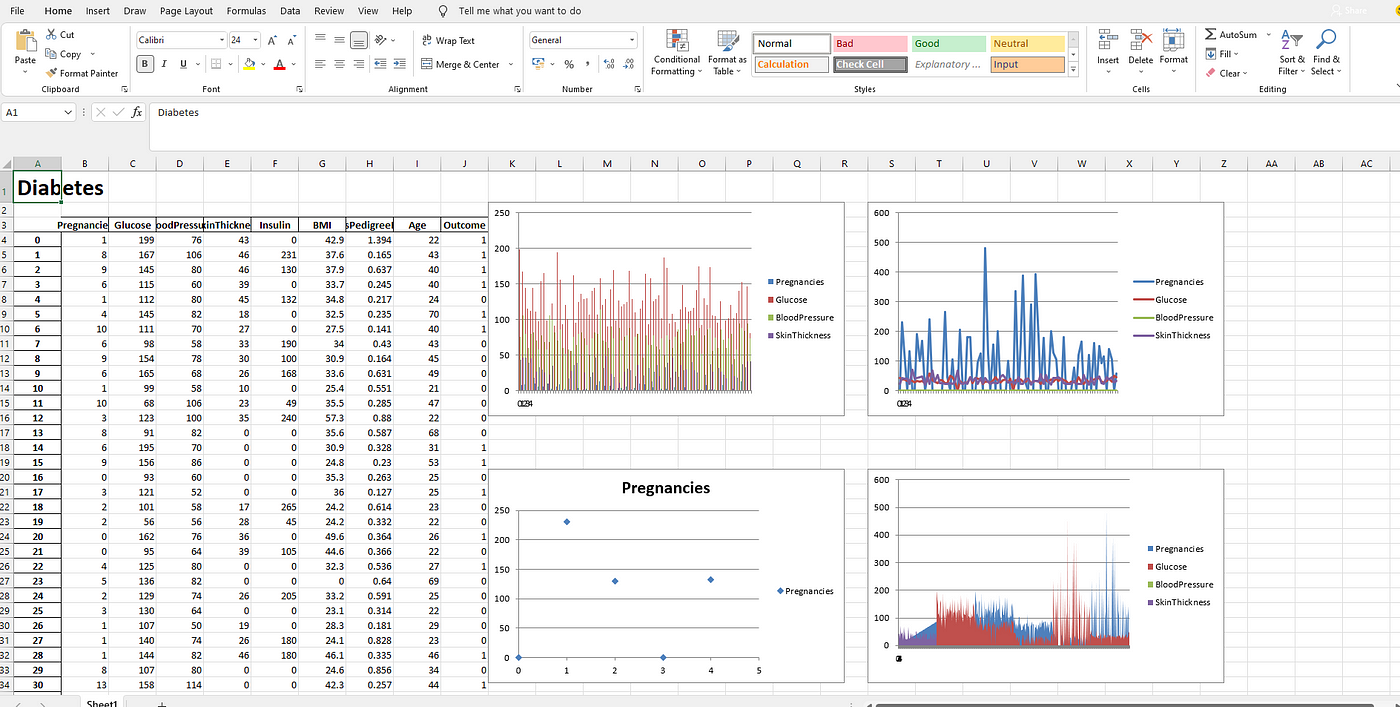
Um pequeno tutorial para utilizar ExcelWriter em Python
Using ExcelWriter for Creating Visualizations in Excel by Python Code
Himanshu Sharma4 days ago·3 min read
Excel is widely used for data analysis and has a lot of functionalities for analyzing, manipulating, visualizing, etc. Using excel should be one of the main skills required for a Data Analyst, Product Analyst, and Business Analyst. It helps in understanding the data and how we can use it for generating useful insights.
Python is also widely used for Data Analysis purposes and also overcomes the drawbacks of Excel. With a little knowledge of Python, we can enhance our Data Analysis skills and also generate more useful insights.
Combining both Excel and Python can be fruitful and makes Data Analysis more interesting. ExcelWriter is used for performing different Excel operations using Python. It provides a wide variety of functionalities like creating an Excel, writing data into an Excel sheet, creating visualizations in Excel, etc.
Tags: dataviz, Excel, Python, visualizações
A Better Way for Data Preprocessing: Pandas Pipe
Posted by Armando Brito Mendes | Filed under Data Science, lições, linguagens de programação, materiais ensino, materiais para profissionais

Um pequeno tutorial sobre como começar a usar o pipe
Efficient, organized, and elegant.
Soner YıldırımJul 31·4 min read
Real-life data is usually messy. It requires a lot of preprocessing to be ready for use. Pandas being one of the most-widely used data analysis and manipulation libraries offers several functions to preprocess the raw data.
In this article, we will focus on one particular function that organizes multiple preprocessing operations into a single one: the pipe function.
When it comes to software tools and packages, I learn best by working through examples. I keep this in mind when creating content. I will do the same in this article.
Tags: pipe, préprocessamento, Python
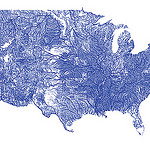
Race and ethnicity across the nation
Posted by Armando Brito Mendes | Filed under Data Science, materiais para profissionais, relatórios, visualização
Bom relatório com mapa de pontos
By John Keefe, Daniel Wolfe and Sergio Hernandez, CNNPublished Aug. 12, 2021
The United States is more diverse and has more people than ever before, with much of the growth occurring in and around metropolitan areas, according to the 2020 census. By plotting the population onto a map of the country according to density and group, it’s possible to get a bird’s-eye view of where we live and how we identify.
Tags: gráfico de pontos, mapa de pontos, mapas
aRtsy: Generative Art with R and ggplot2
Posted by Armando Brito Mendes | Filed under linguagens de programação, materiais ensino, materiais para profissionais, software, visualização

Um pacote para o R para criar arte generativa
“If you laugh at a joke, what difference does it make if subsequently you are told that the joke was created by an algorithm?” – Marcus du Sautoy, The Creative Code
aRtsy is an attempt at making generative art available for the masses in a simple and standardized format. The package provides various algorithms for creating artworks in ggplot2 that incorporate some form of randomness (depending on the set seed). Each type of artwork is implemented in a separate function.
Good luck hunting for some good seed’s! Feel free to post a comment with your best artworks and the corresponding seed in the GitHub discussions.
Contributions to aRtsy are very much appreciated! If you want to add your own type of artwork to the package so that others can also create them, feel free to make a pull request to the GitHub repository. Don’t forget to adjust generate-artwork.R if you also want the artwork to show up in the ‘Artwork of the day’ category and the twitter feed.
Republicans Fall Short in Voting-Rights Crackdown While Adding Hassle at Polls
Posted by Armando Brito Mendes | Filed under Data Science, materiais para profissionais, relatórios, visualização

Bom relatório sobre a produção de legislação nos EUA com gráficos muito originais.
A nationwide move by Republicans to tighten voting rules in the wake of Donald Trump’s defeat has largely fizzled into a few additional hassles for voters in the next elections, far short of the sweeping changes described by both the GOP and Democratic critics.
In the name of election security, Republican lawmakers passed dozens of new voting restrictions this year, adding hurdles to mail-in voting, reducing local control over elections and targeting innovations used by large urban counties during the coronavirus pandemic, even as Democratic-led states focused on making voting easier.
Tags: gráficos, legislação, visualização
10 Guidelines for DataViz Accessibility
Posted by Armando Brito Mendes | Filed under Data Science, materiais para profissionais, visualização
10 regras para construir representações de dados mais inclusivas
Introduction
In a world that surrounds us with information at all times, data visualization is increasingly more popular, as a tool to help us make sense of the information, and to grab the attention of users and readers. This has significant implications for the overall accessibility of data. In this article we are exploring the accessibility problems of data visualizations, and how to start solving them.
What is data visualization meant to do?
Before we dive into the accessibility implications of data visualizations, it is useful to consider the value they are meant to provide to the user. This will help us think about how to provide value to all users – including users with various disabilities.
Tags: acessibilidade, dataviz
how you can use the JavaScript library React with D3.js
Posted by Armando Brito Mendes | Filed under materiais para profissionais, software, visualização
Bom tutorial para o uso das tecnologias de visualização de dados.
React.js is a JavaScript library that helps with building complex user interfaces. This website is written using React!
I would recommend being familiar with React for this article. It might be worth running through the official tutorial or running through a book (I’ve heard good things about this one) to make sure you don’t stumble on anything in here!
Tags: D3.js, java script, react
API Integration in Python
Posted by Armando Brito Mendes | Filed under linguagens de programação, materiais para profissionais, software

able of Contents